|

USD/CHF stable at the bottom of a downtrend

  • USD/CHF trades sideways near 8-month low, below 20-SMA.

  • Short-term outlook is hazy, but optimism is still there.

  • Key resistance at 0.8522; support at 0.8330.

USDCHF

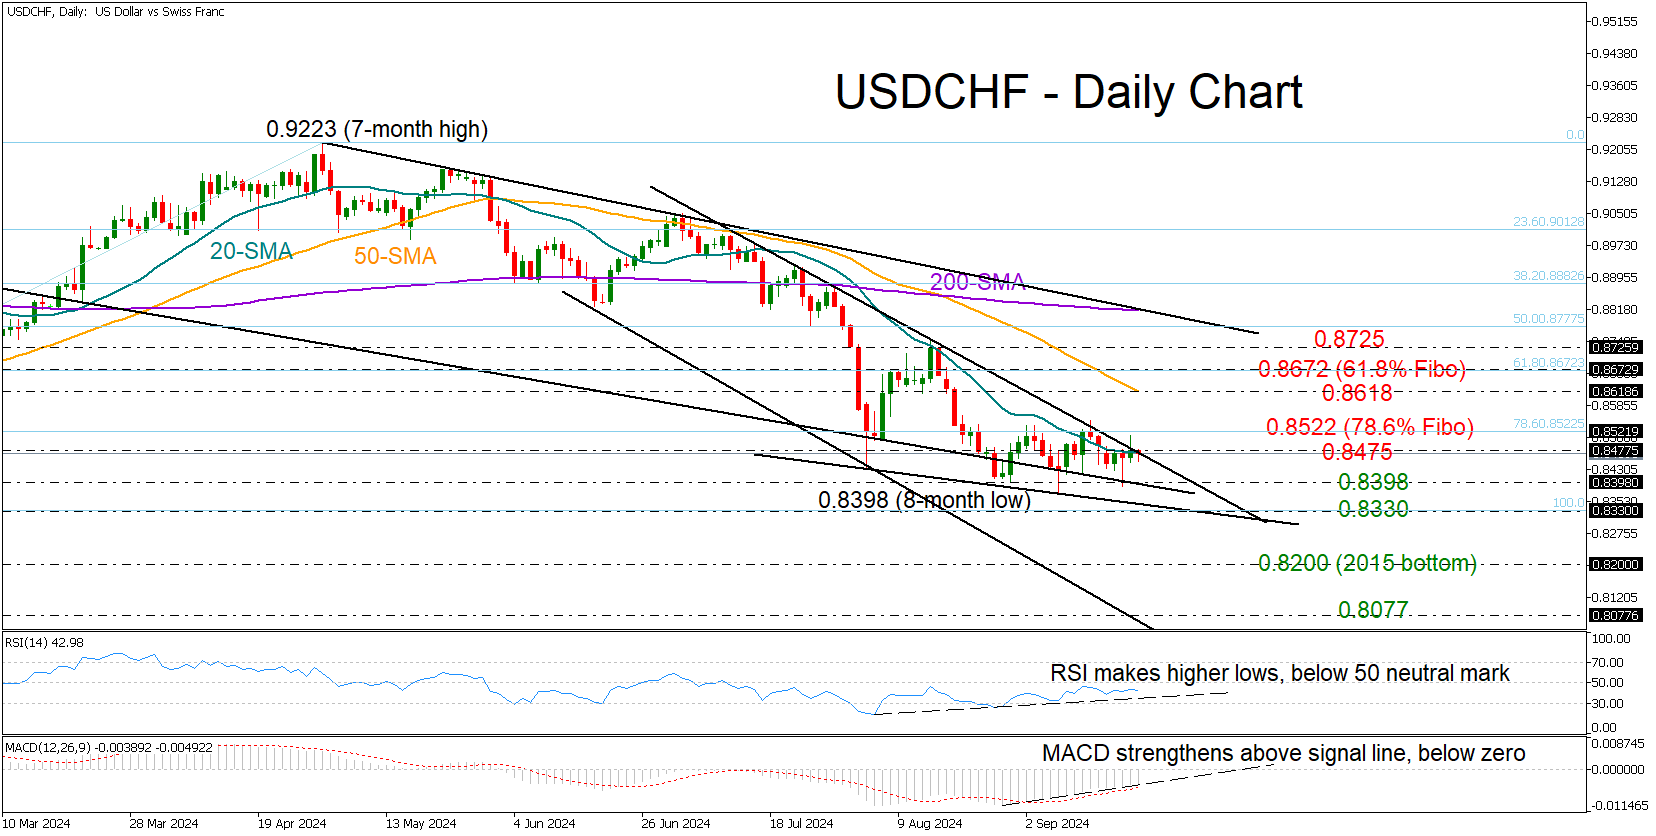
USDCHF has been in a tight range within the 0.8400 region so far this week, remaining trapped below its 20-day simple moving average (SMA) and the resistance trendline from July near 0.8470.

Despite the absence of strong bullish signals, the bullish divergence in the RSI and MACD remains a source of optimism for a positive reversal.

Nonetheless, buyers might adopt a wait-and-see approach until the price breaks above 0.8475 and moves out of its horizontal path above 0.8522. The latter overlaps with the 78.6% Fibonacci retracement of the December 2023-April 2024 upleg. Hence, a violation there could activate a new bullish wave towards the 50-day SMA at 0.8618. Further up, the pair may take a breather around the 61.8% Fibonacci mark of 0.8672 before stretching towards the 0.8725 bar.

A potential support level might form near the declining constraining line from October 2023 at 0.8398. The 9-year low of 0.8330 registered in December 2023 could be the next destination. Sellers must breach that base to access the critical 2015 floor of 0.8200. Even lower, the spotlight will turn to the bottom of the bearish channel seen near 0.8077.

In conclusion, USDCHF is expected to remain neutral in the short-term, unless it runs above 0.8522 or below 0.8330.

Author

Christina Parthenidou

Christina joined the XM investment research department in May 2017. She holds a master degree in Economics and Business from the Erasmus University Rotterdam with a specialization in International economics.

More from Christina Parthenidou
Share:

Editor's Picks

EUR/USD treads water around 1.1900

EUR/USD edges a tad lower around the 1.1900 area, coming under mild pressure despite the US Dollar keeps the offered stance on turnaround Tuesday. On the US data front, December Retail Sales fell short of expectations, while the ADP four week average printed at 6.5K.

GBP/USD looks weak near 1.3670

GBP/USD trades on the back foot around the 1.3670 region on Tuesday. Cable’s modest retracement also comes in tandem with the decent decline in the Greenback. Moving forward, the US NFP and CPI data in combination with key UK releases should kee the quid under scrutiny in the next few days.

Gold the battle of wills continues with bulls not ready to give up

Gold comes under marked selling pressure on Tuesday, giving back part of its recent two day advance and threatening to challenge the key $5,000 mark per troy ounce. The yellow metal’s correction follows a better tone in the risk complex, a lower Greenback and shrinking US Treasuty yields.

AI Crypto Update: BankrCoin, Pippin surge as sector market cap steadies above $12B

The Artificial Intelligence (AI) segment is largely on the back foot with major coins such as Bittensor (TAO) and Internet Computer (ICP) extending losses amid a sticky risk-off sentiment.

Dollar drops and stocks rally: The week of reckoning for US economic data

Following a sizeable move lower in US technology Stocks last week, we have witnessed a meaningful recovery unfold. The USD Index is in a concerning position; the monthly price continues to hold the south channel support.

XRP holds $1.40 amid ETF inflows and stable derivatives market

Ripple trades under pressure, with immediate support at $1.40 holding at the time of writing on Tuesday. A recovery attempt from last week’s sell-off to $1.12 stalled at $1.54 on Friday, leading to limited price action between the current support and the resistance.