USD/CHF found sellers after Elliott Wave double three pattern
In this technical article we’re going to take a look at the Elliott Wave charts of USDCHF forex pair published in members area of the website. As our members know USDCHF has recently made recovery against the 0.944 04 peak that has unfolded as Elliott Wave Double Three Pattern. It made clear 7 swings from the lows and completed correction at the extreme zone (Blue Box- selling area) . In further text we’re going to explain the Elliott Wave pattern and trading strategy
Before we take a look at the real market example, let’s explain Elliott Wave Double Three pattern.
Elliott Wave double three pattern
Double three is the common pattern in the market, also known as 7 swing structure. It’s a reliable pattern which is giving us good trading entries with clearly defined invalidation levels.
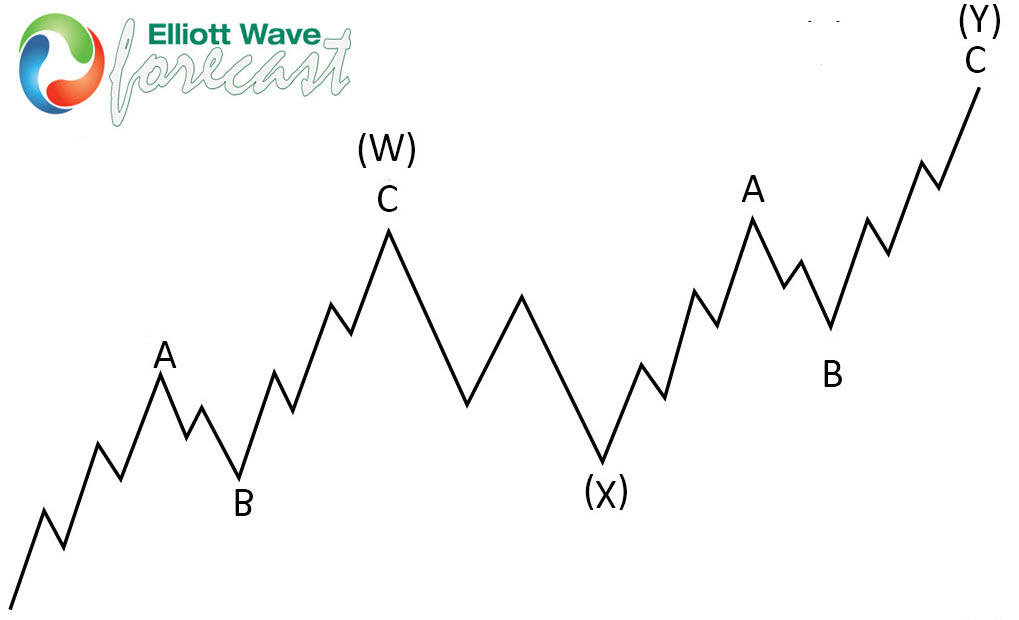
The picture below presents what Elliott Wave Double Three pattern looks like. It has (W),(X),(Y) labeling and 3,3,3 inner structure, which means all of these 3 legs are corrective sequences. Each (W) and (Y) are made of 3 swings, they’re having A,B,C structure in lower degree, or alternatively they can have W,X,Y labeling.
USD/CHF 4h hour Elliott Wave analysis 05.16.2023
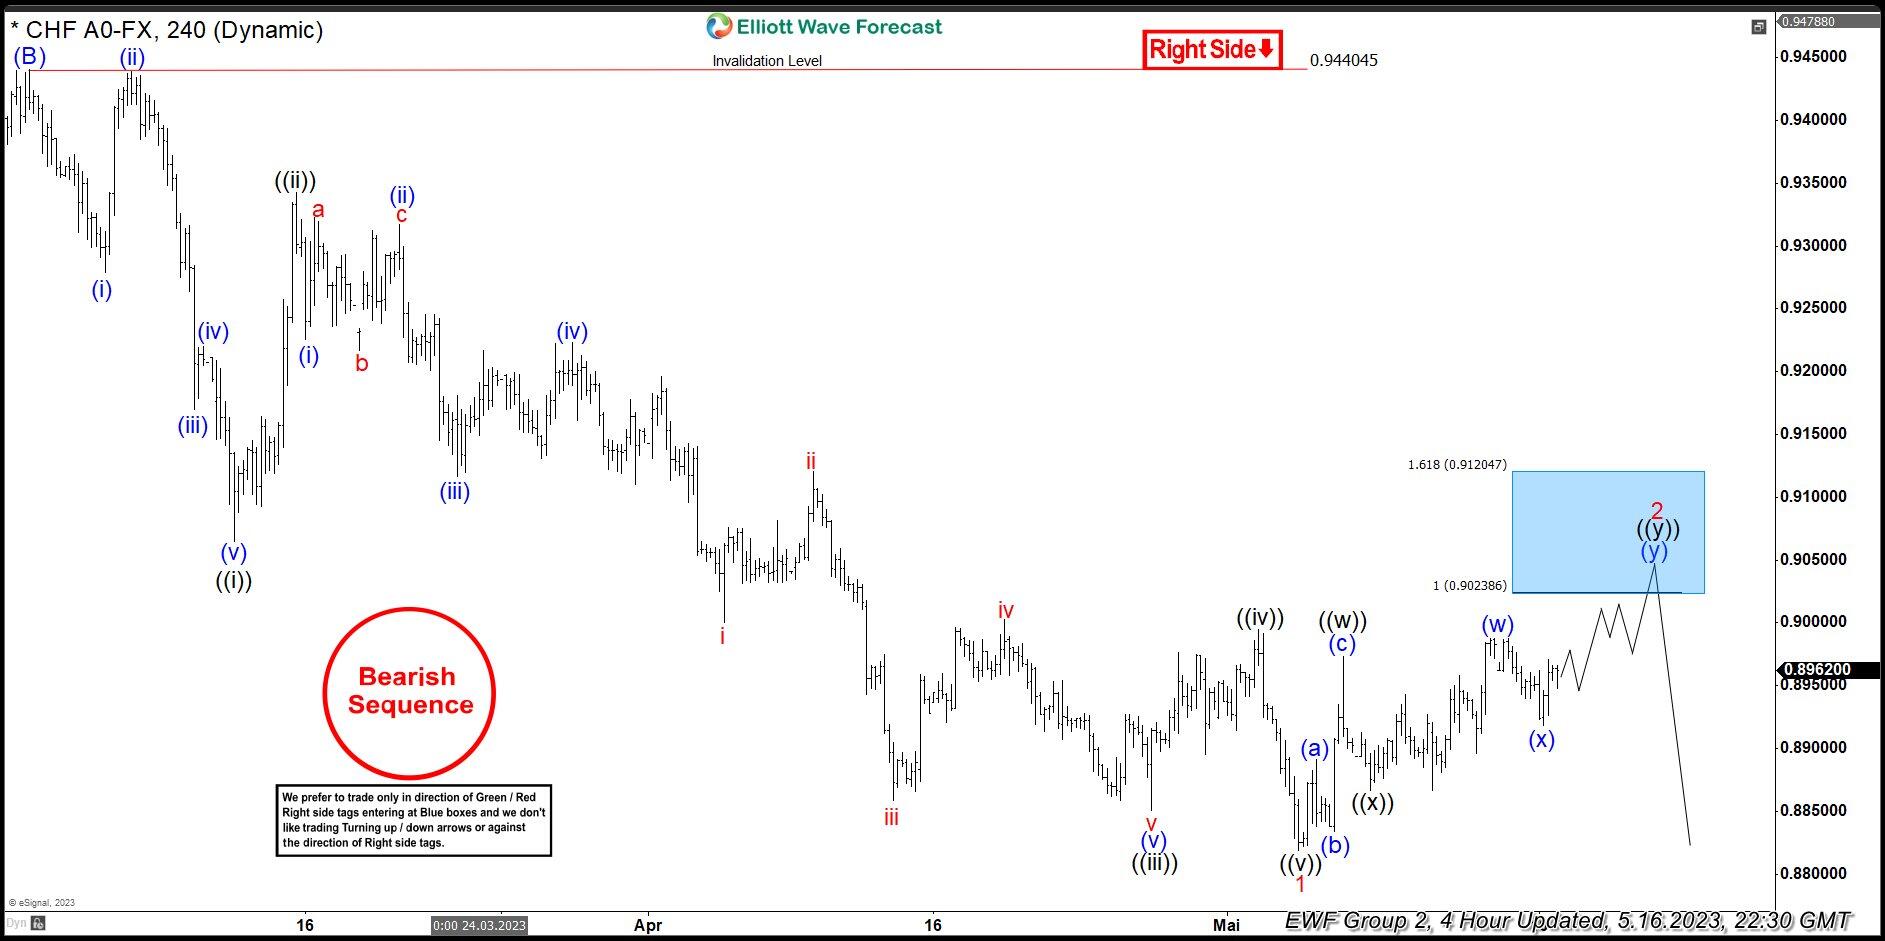
USDCHF ended cycle from the 0.94404 peak as 5 waves structure. Currently the pair is giving us 2 red recovery that is unfolding as Elliott Wave Double Three Pattern. Correction has ((w))((x))((y)) black inner labeling, when the price structure is still incomplete. We expect to see more short term strength in 7th swing toward 0.90238-0.91204 area to complete correction. At that zone we would like to be sellers. We can see either decline toward new lows or larger 3 waves pull back at least. Invalidation for the selling setup would be break above 1.618 fib ext level: 0.91204
USD/CHF 1h hour Elliott Wave analysis 05.22.2023
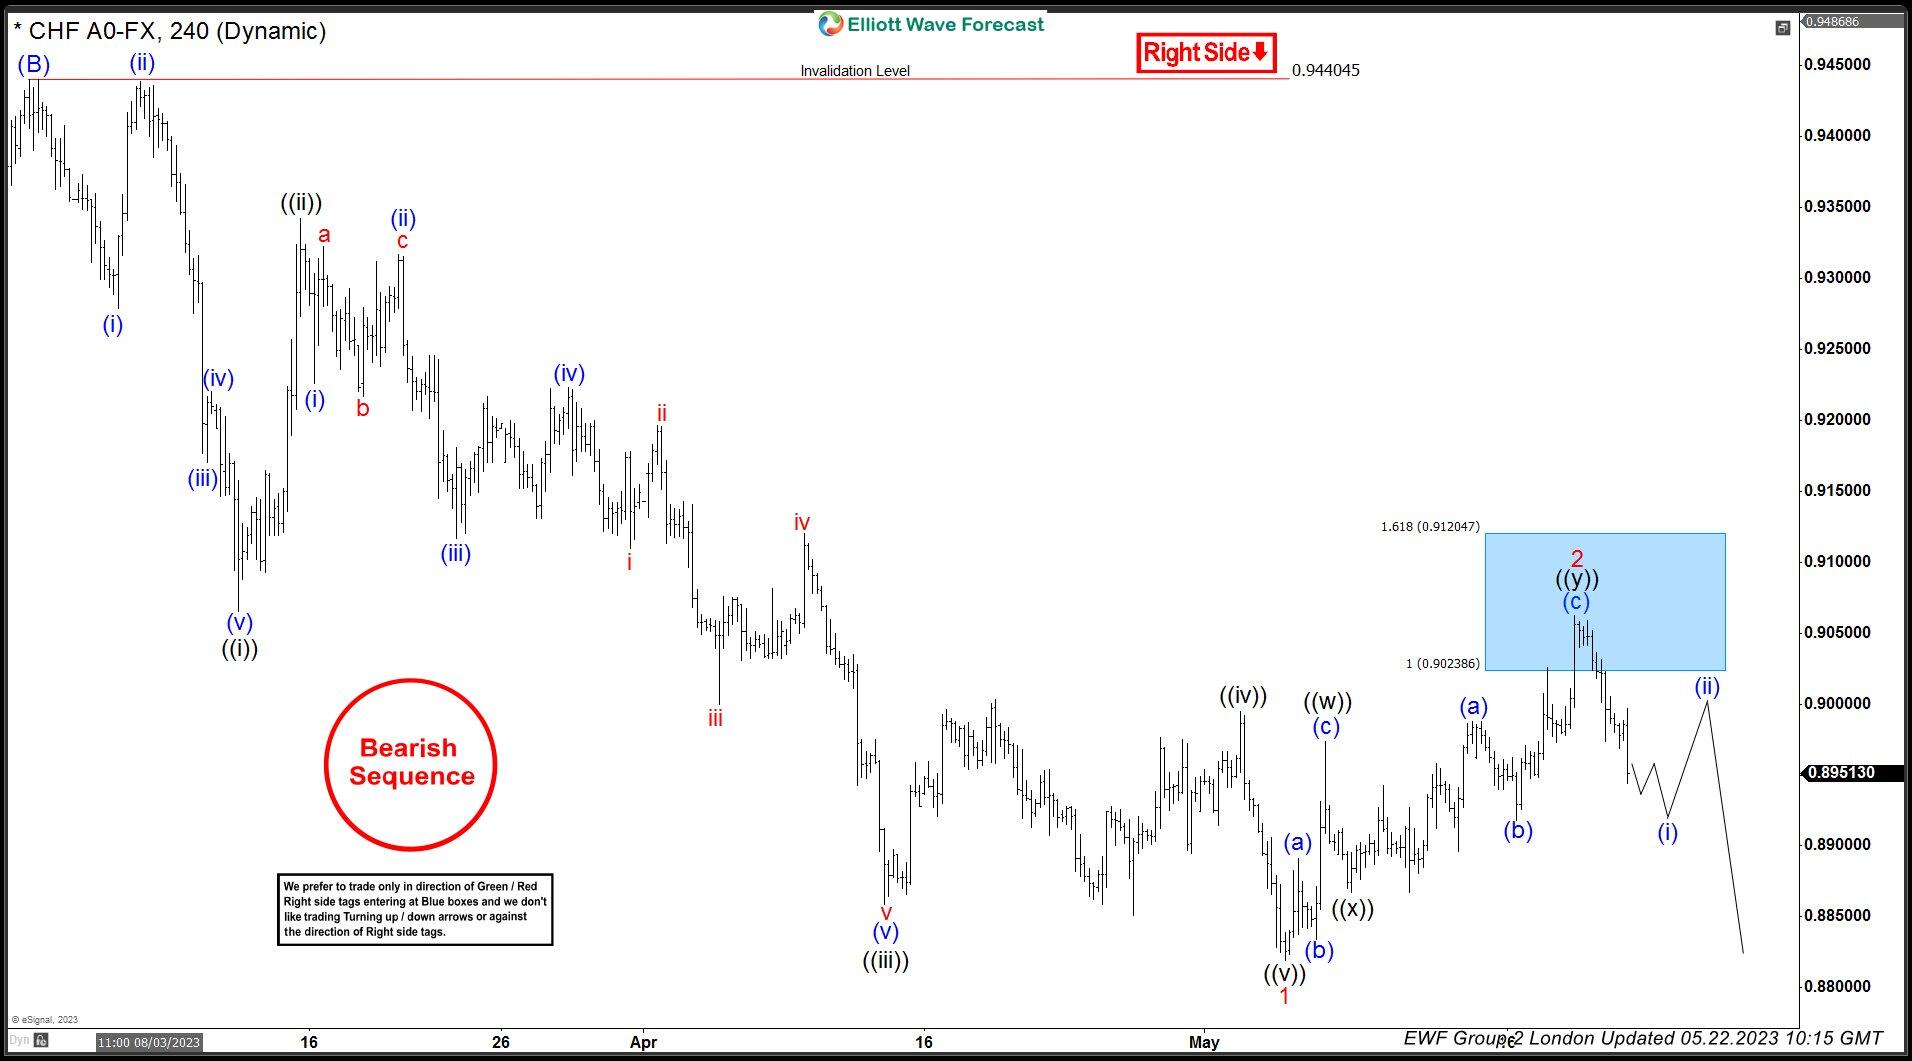
USDCHF made extension higher and reached our selling zone : 0.90238-0.91204. The pair found sellers and made nice reaction from the blue as we expected. All short positions should be risk free at this stage+ partial profit taken. Current view suggests 2 red recovery completed at 0.90625 high. As far as the price holds below that peak, further weakness should follow. We should wait for a break of 1 red low, before selling the pair again.
Author

Elliott Wave Forecast Team
ElliottWave-Forecast.com


