USD/CHF Elliott Wave technical analysis [Video]
![USD/CHF Elliott Wave technical analysis [Video]](https://editorial.fxsstatic.com/images/i/USDCHF-neutral-object_XtraLarge.png)
USDCHF Elliott Wave Analysis – Trading Lounge.
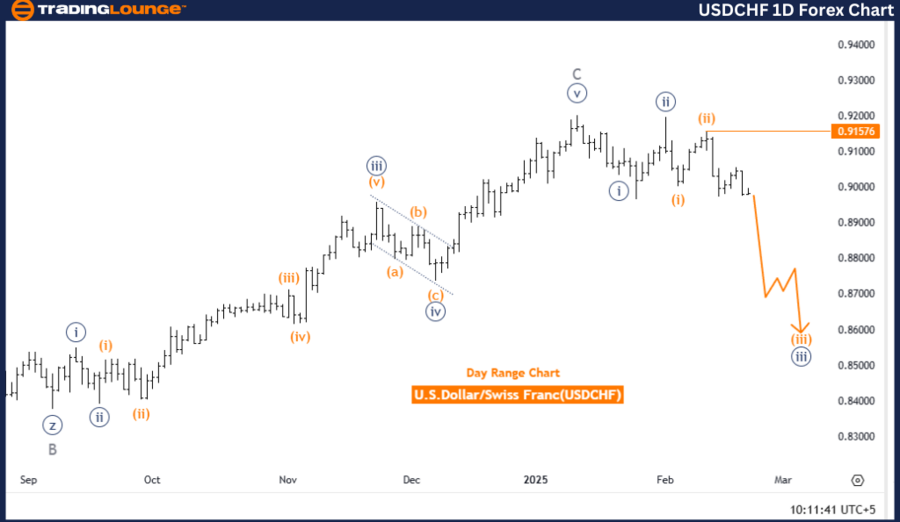
U.S. Dollar/Swiss Franc (USDCHF) Day Chart.
USD/CHF Elliott Wave technical analysis
-
Function: Bearish Trend.
-
Mode: Impulsive.
-
Structure: Orange Wave 3.
-
Position: Navy Blue Wave 3.
-
Direction next lower degree: Orange Wave 3 (Started).
-
Wave cancel invalidation level: 0.91576.
Analysis details
The USDCHF daily chart reflects a bearish trend with an impulsive wave structure. The market is currently progressing within Orange Wave 3, indicating continued downward momentum.
The previous Orange Wave 2 has completed, marking the transition into Orange Wave 3, confirming the bearish trend remains intact. As the market moves lower, the potential for further price declines increases.
The current market position lies within Navy Blue Wave 3, further strengthening the overall downward trend. The next lower-degree wave, also Orange Wave 3, has already begun, signaling a strong bearish phase.
Summary
The USDCHF daily chart maintains a strong bearish outlook, with Orange Wave 3 actively developing. The completion of Orange Wave 2 suggests that the market has entered a new downward phase. As long as the wave structure holds, further price declines are anticipated.
The wave cancel invalidation level is set at 0.91576—a move above this level would invalidate the current Elliott Wave count and could indicate a potential shift in market direction.
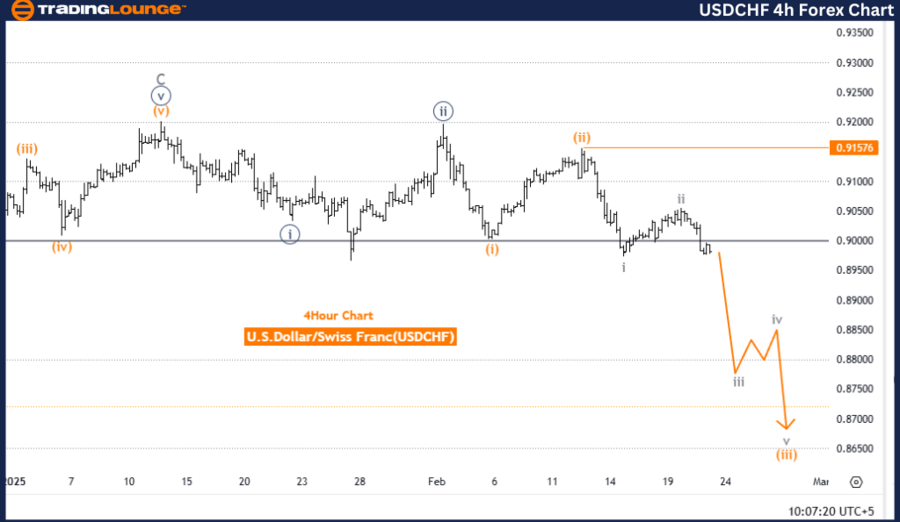
U.S. Dollar/Swiss Franc (USDCHF) 4-Hour Chart.
USD/CHF Elliott Wave technical analysis
-
Function: Bearish Trend.
-
Mode: Impulsive.
-
Structure: Gray Wave 3.
-
Position: Orange Wave 3.
-
Direction next lower degree: Gray Wave 3 (Started).
-
Wave cancel invalidation level: 0.91576.
Analysis details
The USDCHF Elliott Wave Analysis for the 4-hour chart confirms a bearish trend for the U.S. Dollar against the Swiss Franc. This analysis is based on Elliott Wave Theory, which identifies repetitive wave patterns in price movements.
The current market mode is impulsive, suggesting a strong directional movement. The structure follows Gray Wave 3, which forms part of the larger Orange Wave 3. This indicates that the bearish trend is in a strong downward phase.
The analysis shows that Gray Wave 2 of Orange Wave 3 has completed, and now Gray Wave 3 is active. In Elliott Wave sequences, Wave 3 is often the strongest and most extended, reinforcing the bearish market outlook. The next lower-degree wave, Gray Wave 3, has already started, signaling further downside movement.
Key levels to watch
A critical level to monitor is 0.91576, the wave cancel invalidation level. If the price moves above this level, the current wave count would be invalidated, potentially altering the bearish outlook. Traders should closely track this level, as it serves as a key threshold for confirming the ongoing bearish trend.
Summary
The USDCHF 4-hour chart analysis suggests a continuation of the bearish trend, with Gray Wave 3 currently in progress. The completion of Gray Wave 2 and the activation of Gray Wave 3 confirm strong downward momentum.
The invalidation level at 0.91576 is a crucial point to monitor—a break above this level could disrupt the current bearish wave structure. Traders should remain cautious and incorporate this analysis into their trading decisions. The ongoing impulsive wave structure suggests that the market is likely to continue its downward trajectory in the near term.
Technical analyst: Malik Awais.
USD/CHF Elliott Wave technical analysis [Video]
Author

Peter Mathers
TradingLounge
Peter Mathers started actively trading in 1982. He began his career at Hoei and Shoin, a Japanese futures trading company.


