USD/CHF Elliott Wave technical analysis [Video]
![USD/CHF Elliott Wave technical analysis [Video]](https://editorial.fxstreet.com/images/Markets/Currencies/Majors/USDCHF/swiss-currency-francs-4064962_XtraLarge.jpg)
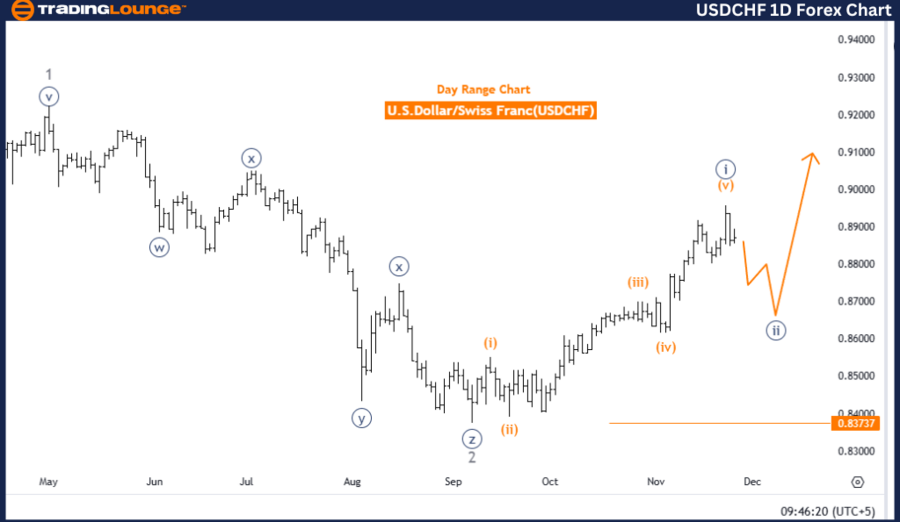
USDCHF Elliott Wave Analysis – Trading Lounge.
U.S. Dollar/Swiss Franc (USDCHF) – Day Chart Analysis.
USD/CHF Elliott Wave technical analysis
-
Function: Counter Trend.
-
Mode: Corrective.
-
Structure: Navy Blue Wave 2.
-
Position: Gray Wave 3.
-
Direction of next higher degrees: Navy Blue Wave 3.
Details
Navy Blue Wave 1 appears complete, and Navy Blue Wave 2 is currently unfolding.
-
Wave Cancel Invalid Level: 0.83737.
This analysis focuses on the USDCHF currency pair using the Elliott Wave theory applied to a daily chart. The pair is currently in a counter-trend phase, which indicates a temporary reversal within the larger trend. The primary structure under observation is Navy Blue Wave 2, following the confirmed completion of Navy Blue Wave 1. This corrective phase is expected to develop further before the market transitions into the next impulsive wave.
At present, the price is positioned within gray wave 3, a smaller wave contained within the larger navy blue wave 2 structure. This phase highlights the continuation of the counter-trend movement. More developments are anticipated before transitioning to navy blue wave 3, marking the resumption of the impulsive higher-degree trend.
Key threshold: Invalidation level
The invalidation level is set at 0.83737. If the price reaches this level, the current wave count and analysis will be invalidated. This threshold serves as a critical reference for traders to manage risks and confirm the validity of the ongoing corrective wave.
Conclusion
The Elliott Wave analysis indicates that USDCHF is currently in a counter-trend phase, with navy blue wave 2 in progress. The completion of navy blue wave 1 marked the beginning of this corrective phase, and gray wave 3 reflects the ongoing activity within it. The counter-trend outlook remains valid as long as the price holds above the invalidation level of 0.83737. Further corrective movement is expected before transitioning to the impulsive phase in navy blue wave 3.
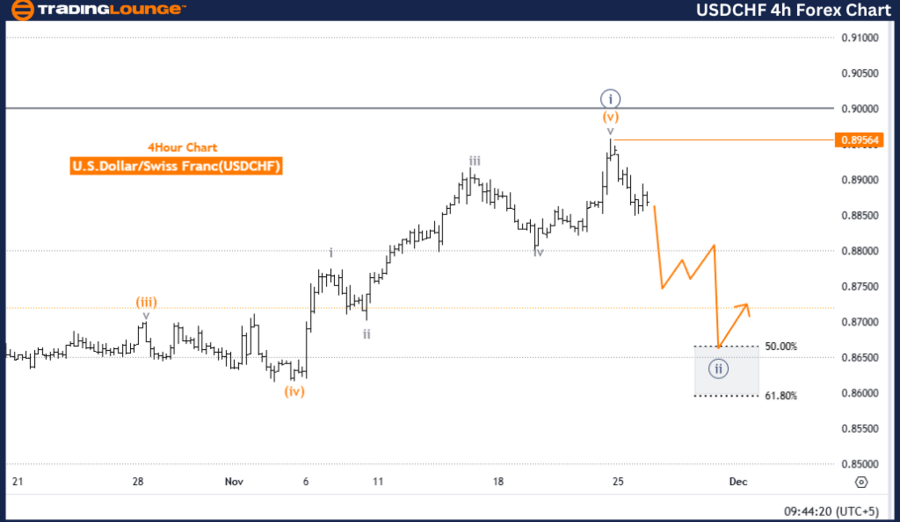
U.S. Dollar/Swiss Franc (USDCHF) – 4-Hour Chart Analysis.
USD/CHF Elliott Wave technical analysis
-
Function: Counter Trend.
-
Mode: Corrective.
-
Structure: Navy Blue Wave 2.
-
Position: Gray Wave 3.
-
Direction of next higher degrees: Navy Blue Wave 3.
Details
Navy Blue Wave 1 appears to be complete, with Navy Blue Wave 2 currently unfolding.
-
Wave Cancel Invalid Level: 0.89564.
This analysis evaluates the USDCHF currency pair using Elliott Wave theory applied to a 4-hour chart. The pair is in a counter-trend phase, indicating a temporary reversal within the broader market trend. The primary structure under examination is Navy Blue Wave 2, which began following the completion of Navy Blue Wave 1. This corrective phase is expected to develop further before the next impulsive wave emerges.
The current market position is within gray wave 3, a smaller wave inside the larger navy blue wave 2 corrective structure. This stage highlights the continuation of the counter-trend movement. Additional development is anticipated before the market transitions into navy blue wave 3, resuming the upward impulsive trend.
Key threshold: Invalidation level
The invalidation level is specified at 0.89564. If the price drops to this level, the current wave count and analysis will become invalid. This threshold acts as a vital reference point for traders to confirm the corrective phase or reassess their positions, ensuring effective risk management.
Conclusion
The Elliott Wave analysis suggests that USDCHF is currently in a counter-trend phase, with navy blue wave 2 in progress. The completion of navy blue wave 1 marked the beginning of this corrective phase, while gray wave 3 reflects the ongoing activity within the structure. The counter-trend outlook remains intact as long as the price remains above the invalidation level of 0.89564. This analysis anticipates continued corrective movement before transitioning into the impulsive phase associated with Navy Blue Wave 3.
Technical analyst: Malik Awais.
USD/CHF Elliott Wave technical analysis [Video]
Author

Peter Mathers
TradingLounge
Peter Mathers started actively trading in 1982. He began his career at Hoei and Shoin, a Japanese futures trading company.


