USD/CHF Elliott Wave technical analysis [Video]
![USD/CHF Elliott Wave technical analysis [Video]](https://editorial.fxstreet.com/images/Markets/Currencies/Majors/USDCHF/coins-and-notes-from-switzerland-17730378_XtraLarge.jpg)
USD/CHF Elliott Wave technical analysis
-
Function: Counter Trend.
-
Mode: Corrective.
-
Structure: Navy Blue Wave 2.
-
Position: Gray Wave 3.
-
Next higher degree direction: Navy Blue Wave 3.
-
Details: Navy Blue Wave 1 is complete; Navy Blue Wave 2 is currently in progress.
-
Wave invalidation level: 0.83765.
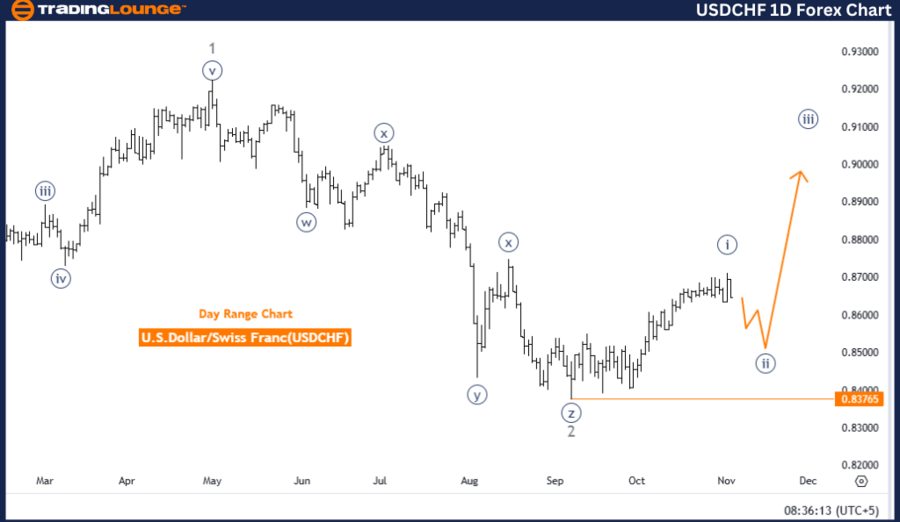
The USDCHF daily chart's Elliott Wave analysis highlights a counter-trend corrective structure, centering on Navy Blue Wave 2, which follows the completion of the preceding impulsive Navy Blue Wave 1. This corrective phase, Wave 2, signals a temporary consolidation or retracement within the larger trend. Positioned within Gray Wave 3, this movement suggests a pullback that allows for market adjustment before the anticipated trend resumption.
According to Elliott Wave theory, corrective waves like Navy Blue Wave 2 typically offer brief counter-movements against the primary trend, presenting a pause or retracement. Upon concluding, the primary trend is likely to continue with Navy Blue Wave 3, indicating further upward momentum in line with the direction established in Wave 1.
The wave cancel level is crucially set at 0.83765. A price movement below this threshold would invalidate the current wave structure, possibly indicating a deviation from the anticipated pattern. Sustaining price action above this level maintains the integrity of the corrective wave and the transition into the expected Navy Blue Wave 3, aligning with the broader bullish trend.
This analysis underscores the significance of Navy Blue Wave 2 in preparing for the next phase. Should this corrective phase resolve without breaching the invalidation level, it opens the potential for the next impulsive wave, consistent with the higher-degree Navy Blue Wave 3. This setup hints at a bullish outlook post-consolidation, contingent on validation at the key wave cancel level.
USD/CHF day chart
USD/CHF Elliott Wave technical analysis
-
Function: Counter Trend.
-
Mode: Corrective.
-
Structure: Navy Blue Wave 2.
-
Position: Gray Wave 3.
-
Next higher degree direction: Navy Blue Wave 3.
-
Details: Navy Blue Wave 1 is completed; Navy Blue Wave 2 is currently active.
-
Wave invalidation level: 0.83765.
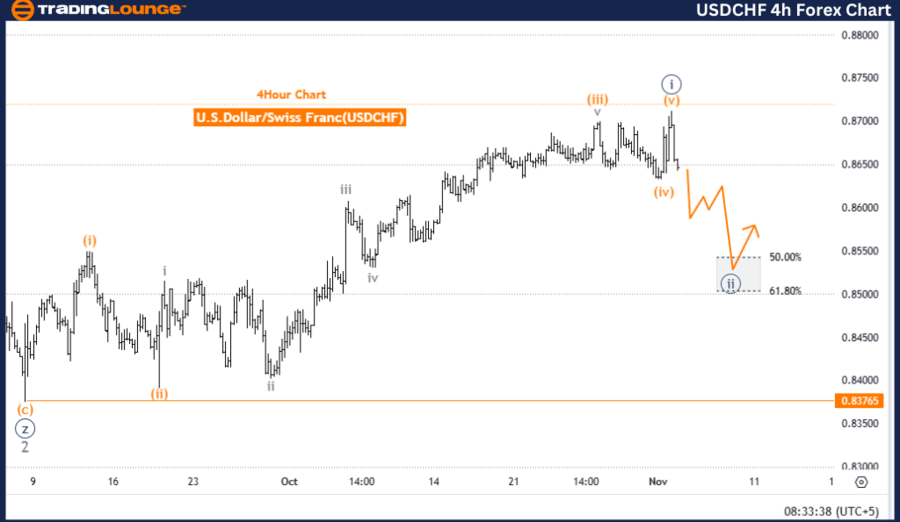
The USDCHF 4-hour chart Elliott Wave analysis reveals a counter-trend corrective pattern, with Navy Blue Wave 2 actively unfolding after the completion of Navy Blue Wave 1. This structure suggests a period of consolidation that may precede a resumption of the primary trend in the upcoming wave phase.
Gray Wave 3 is nested within this corrective Navy Blue Wave 2, indicating a potential pullback or sideways price movement typical of corrective phases. Elliott Wave theory posits that such corrective waves counterbalance the dominant trend, offering a period of retracement or consolidation that sets the stage for the next impulsive move.
The next higher degree move is projected as Navy Blue Wave 3, expected to resume the primary trend upon the conclusion of this corrective phase. This shift would likely align with the upward direction seen in Navy Blue Wave 1, implying that Navy Blue Wave 2 is a preparatory phase leading into further trend continuation.
The wave cancel level, defined at 0.83765, serves as a key threshold for the current wave count. Should the price drop below this level, it would invalidate the current structure and may indicate a divergence from the projected wave pattern. Maintaining price above this level supports the validity of Navy Blue Wave 2 and sets up for a continuation into Navy Blue Wave 3, suggesting further potential upside following this corrective phase.
USD/CHF four-hour chart
USD/CHF Elliott Wave technical analysis [Video]
Author

Peter Mathers
TradingLounge
Peter Mathers started actively trading in 1982. He began his career at Hoei and Shoin, a Japanese futures trading company.


