USD/CHF Elliott Wave technical analysis [Video]
![USD/CHF Elliott Wave technical analysis [Video]](https://editorial.fxstreet.com/images/Markets/Currencies/Majors/USDCHF/swiss-money-with-coins-ii-2022332_XtraLarge.jpg)
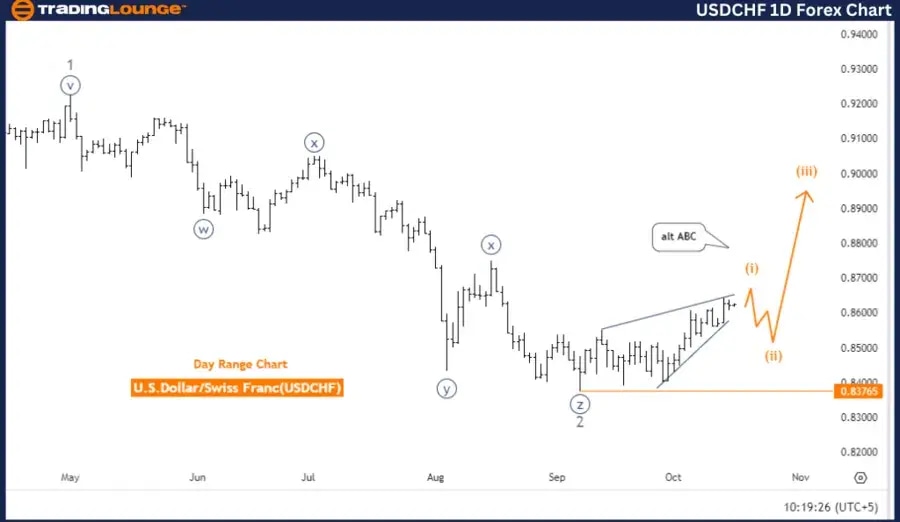
USDCHF Elliott Wave Analysis Trading Lounge Day Chart,
U.S. Dollar/Swiss Franc (USDCHF) Day Chart.
USD/CHF Elliott Wave technical analysis
-
Function: Trend.
-
Mode: Impulsive.
-
Structure: Orange wave 1.
-
Position: Navy Blue Wave 1.
-
Direction next lower degrees: Orange wave 2.
-
Details: Orange wave 1 of navy blue wave 1 is still active, forming as a leading diagonal, and is nearing its completion.
-
Wave cancel invalid level: 0.83765.
The USDCHF Elliott Wave analysis for the daily chart points to a bullish trend, characterized by an impulsive wave structure. The focus is on orange wave 1, which is a part of the larger navy blue wave 1. At present, orange wave 1 of navy blue wave 1 remains active and is developing into a leading diagonal pattern. This pattern suggests that the market is in the early stages of an upward trend, with the leading diagonal approaching its completion.
The impulsive behavior of orange wave 1 reflects strong upward momentum in the market, which is typically seen at the beginning of a broader trend. As orange wave 1 nears its completion, the next anticipated movement is expected to be a corrective phase, unfolding as orange wave 2. This correction would likely bring a temporary pullback in price, offering the market an opportunity to consolidate before continuing its upward trajectory with subsequent waves.
The invalidation level for this wave structure is marked at 0.83765. If the price drops below this level, the current Elliott Wave count will be invalidated, necessitating a re-evaluation of the overall trend. However, as long as the price remains above this threshold, the impulsive wave structure will stay valid, with orange wave 1 expected to conclude soon and orange wave 2 to follow.
Summary: The USDCHF pair is in the early phase of an impulsive upward trend, with orange wave 1 of navy blue wave 1 still in progress. The wave is forming as a leading diagonal and is approaching its end. The next movement is likely a correction through orange wave 2. The invalidation level to monitor is 0.83765, as a breach of this level would call for a re-assessment of the wave structure.
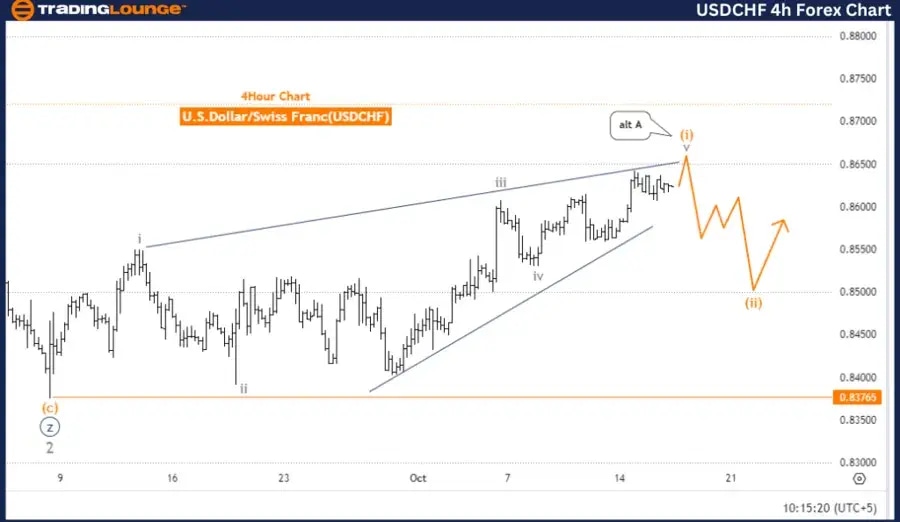
USDCHF Elliott Wave Analysis Trading Lounge 4 Hour Chart, U.S. Dollar / Swiss Franc (USDCHF) 4 Hour Chart
USD/CHF Elliott Wave technical analysis
-
Function: Trend.
-
Mode: Impulsive.
-
Structure: Orange wave 1.
-
Position: Navy blue wave 1.
-
Direction next lower degrees: Orange wave 2.
-
Details: Orange wave 1 of navy blue wave 1 is still developing as a leading diagonal and is nearing its completion.
-
Wave cancel invalid level: 0.83765.
The USDCHF Elliott Wave analysis for the 4-hour chart reflects a bullish trend with an impulsive wave structure. The focus is on orange wave 1, which is part of the broader navy blue wave 1. Currently, price action shows that orange wave 1 of navy blue wave 1 is still unfolding, forming a leading diagonal pattern. This leading diagonal is approaching its end, suggesting that the market is about to enter the corrective phase marked by orange wave 2.
The impulsive nature of orange wave 1 signals strong upward momentum, typically observed during the first wave of a larger trend. As orange wave 1 reaches its completion, a correction is expected in the form of orange wave 2. This corrective move will likely bring a temporary pullback before the larger bullish trend resumes with subsequent waves. The structure and timing of the wave’s completion are crucial for predicting the next phase in USDCHF price movements.
A critical part of this analysis is the invalidation level, set at 0.83765. If the price falls below this level, the current Elliott Wave count would be invalidated, necessitating a re-evaluation of the trend. However, as long as the price stays above this key level, the impulsive wave structure remains intact, with orange wave 1 nearing completion and orange wave 2 expected to follow.
Summary: USDCHF is in the early stages of an impulsive bullish trend, with orange wave 1 of navy blue wave 1 nearing completion. The next expected phase is a corrective move in the form of orange wave 2. Monitoring the invalidation level at 0.83765 is critical to confirming the current wave structure and ensuring the continuation of the upward trend.
Technical analyst: Malik Awais.
USD/CHF Elliott Wave technical analysis [Video]
Author

Peter Mathers
TradingLounge
Peter Mathers started actively trading in 1982. He began his career at Hoei and Shoin, a Japanese futures trading company.


