USD/CHF Elliott Wave technical analysis [Video]
![USD/CHF Elliott Wave technical analysis [Video]](https://editorial.fxstreet.com/images/Markets/Currencies/Majors/USDCHF/swiss-currency-bank-notes-swiss-francs-25074277_XtraLarge.jpg)
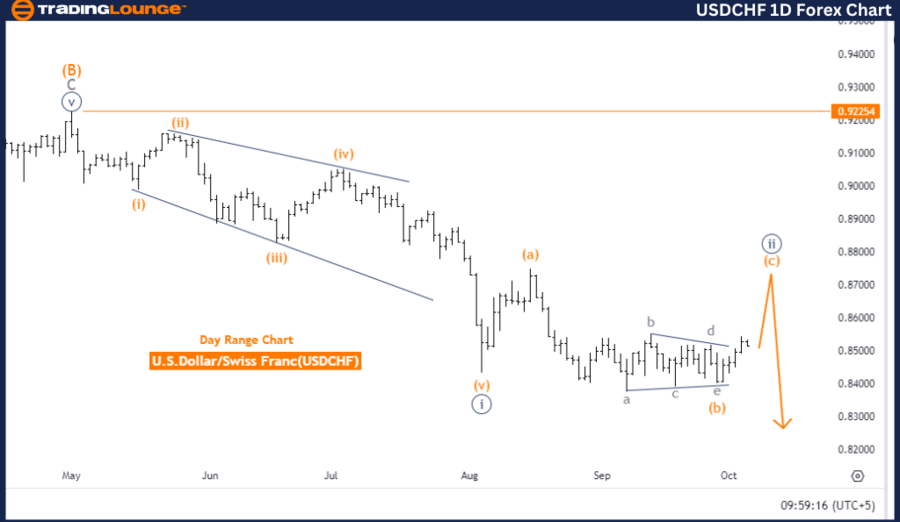
USDCHF Elliott Wave Analysis Trading Lounge Day Chart.
U.S. Dollar/Swiss Franc (USDCHF) Day Chart.
USD/CHF Elliott Wave technical analysis
-
Function: Counter Trend.
-
Mode: Impulsive.
-
Structure: Orange wave C.
-
Position: Navy Blue Wave 2.
-
Direction next lower degrees: Navy blue wave 3.
-
Details: Navy blue wave 1 appears completed, with orange wave C of navy blue wave 2 currently forming.
-
Wave cancel invalidation level: 0.92254.
The USDCHF Elliott Wave Analysis for the daily chart points to a counter-trend phase, indicating a temporary correction against the prevailing trend. The market is currently in an impulsive mode, meaning that despite being corrective, the movement carries substantial momentum. The key wave structure under analysis is orange wave C, part of the larger navy blue wave 2.
At this juncture, navy blue wave 1 has completed, and the market is now developing orange wave C within navy blue wave 2. According to Elliott Wave Theory, wave C is typically the concluding wave in a corrective cycle. Once this wave is complete, the market is expected to resume the main trend by exiting the correction phase.
The analysis further anticipates that the next significant movement will be navy blue wave 3, which will likely emerge after the completion of navy blue wave 2. In Elliott Wave Theory, wave 3 is often the most pronounced and strongest of the impulsive waves, suggesting a powerful resurgence in the market’s primary trend with strong momentum.
A critical level to watch is the wave cancel invalidation level at 0.92254. If the market falls below this threshold, the current Elliott Wave analysis would be invalidated, prompting a reassessment of the market structure. This level acts as a crucial reference to verify the continuation of the ongoing correction.
Summary
The USDCHF Elliott Wave Analysis for the daily chart indicates that the market is in a corrective phase, with orange wave C of navy blue wave 2 progressing. Traders should closely monitor the invalidation level of 0.92254 to confirm the ongoing corrective structure. Upon the completion of navy blue wave 2, navy blue wave 3 is expected to lead the market back into the primary trend with stronger momentum.
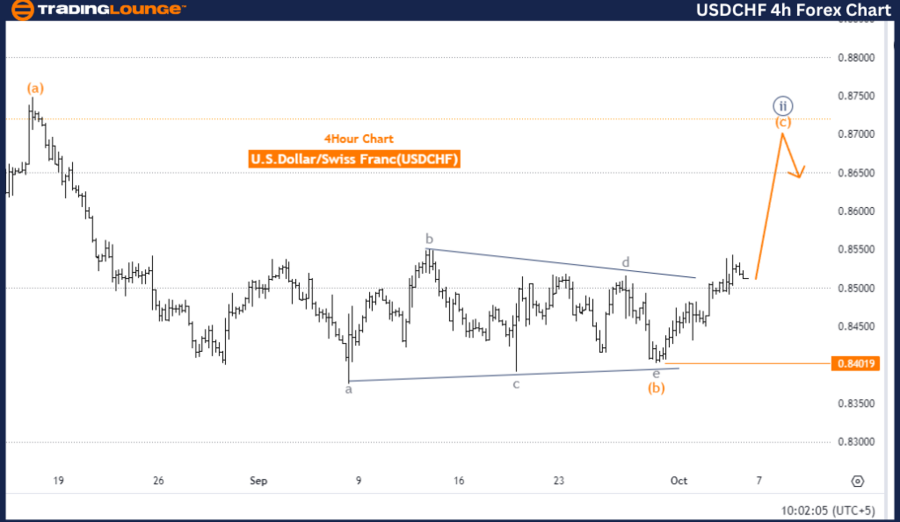
U.S. Dollar/Swiss Franc (USDCHF) 4 Hour Chart.
USD/CHF Elliott Wave technical analysis
-
Function: Counter Trend.
-
Mode: Impulsive.
-
Structure: Orange wave C.
-
Position: Navy Blue Wave 2.
-
Direction next lower degrees: Navy blue wave 3.
-
Details: Navy blue wave 1 appears completed, with orange wave C of navy blue wave 2 currently forming.
-
Wave cancel invalidation level: 0.84019.
The USDCHF Elliott Wave Analysis for the 4-hour chart signals a counter-trend movement, indicating that the market is undergoing a correction against the main trend. The current mode of movement is impulsive, meaning that despite being corrective, the phase is advancing with a well-defined and strong structure. The specific wave under observation is orange wave C, which is part of the broader navy blue wave 2.
At this stage, navy blue wave 1 has been completed, and the market is now forming orange wave C within navy blue wave 2. In Elliott Wave Theory, wave C represents the final wave in a corrective sequence, suggesting that once this wave concludes, the correction phase will end, allowing the market to resume its primary trend.
The next expected movement, as highlighted in the analysis, is navy blue wave 3, which will likely begin after the completion of the current corrective phase. Navy blue wave 3 is generally one of the most extended and powerful waves in an impulsive structure, signaling a potential return to the dominant trend with enhanced momentum after the corrective phase wraps up.
The wave cancel invalidation level to monitor is 0.84019. If the market falls below this threshold, the current Elliott Wave analysis would become invalid, necessitating a reassessment of the wave structure. This level is critical to confirm the continuation of the corrective phase.
Summary
The USDCHF Elliott Wave Analysis for the 4-hour chart suggests that the market is currently in a corrective phase, with orange wave C of navy blue wave 2 in progress. Traders should keep an eye on the invalidation level of 0.84019 to verify the continuation of this corrective wave. Once navy blue wave 2 concludes, navy blue wave 3 is expected to take over, leading the market back into the primary trend with stronger momentum.
Technical analyst: Malik Awais.
USD/CHF Elliott Wave technical analysis [Video]
Author

Peter Mathers
TradingLounge
Peter Mathers started actively trading in 1982. He began his career at Hoei and Shoin, a Japanese futures trading company.


