USD/CHF Elliott Wave technical analysis [Video]
![USD/CHF Elliott Wave technical analysis [Video]](https://editorial.fxstreet.com/images/Markets/Currencies/Majors/USDCHF/swiss-money-with-coins-ii-2022332_XtraLarge.jpg)
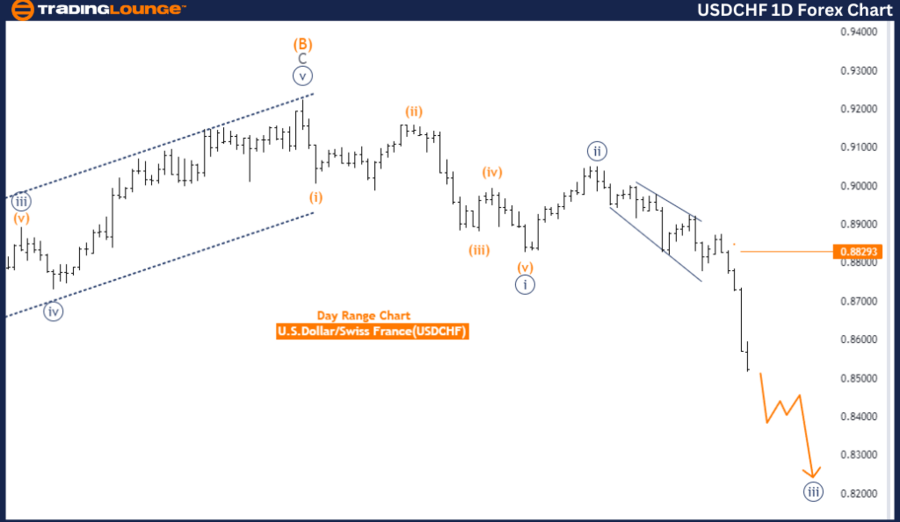
USDCHF Elliott Wave Analysis Trading Lounge Day Chart,
USD/CHF Elliott Wave technical analysis
Function: Trend.
Mode: Impulsive.
Structure: Navy blue wave 3.
Position: Gray wave 1
Direction next higher degrees: Navy blue wave 4.
Details: Navy blue wave 2 looking completed , now navy blue wave 3 is in play.
Wave cancel invalid level: 0.88293.
The USDCHF Elliott Wave Analysis for the daily chart indicates that the market is currently in a trend phase, characterized by an impulsive mode. The primary wave structure identified is navy blue wave 3, suggesting a strong downward movement. The market is positioned within gray wave 1, signifying the beginning of a new upward cycle.
In Elliott Wave theory, wave 3 is typically the most powerful and extended wave, often leading to significant market gains. The completion of navy blue wave 2 indicates that the market has finished its corrective phase and is now progressing through navy blue wave 3. This wave is expected to bring robust bearish momentum to the USDCHF pair, aligning with the trend's overall direction.
The analysis highlights that navy blue wave 2 appears to be completed, signifying the end of a correction and the start of a strong downward phase. With navy blue wave 3 in play, the market is anticipated to experience substantial downward movement. The next higher degree wave, navy blue wave 4, will follow navy blue wave 3, bringing a corrective phase that will temporarily counter the primary trend before resuming its downward trajectory.
The wave cancel invalid level is set at 0.88293. This level is crucial for validating the current wave structure. If the USDCHF pair falls below this level, the existing wave count would be invalidated, meaning the anticipated wave pattern is no longer applicable. In such a case, a reassessment of the market’s direction and wave structure would be necessary.
In summary, the USDCHF Elliott Wave Analysis on the daily chart suggests that the market is in the impulsive phase of navy blue wave 3, positioned within gray wave 1. The completion of navy blue wave 2 indicates a strong downward momentum for the USDCHF pair, with navy blue wave 3 currently in play. The wave cancel invalid level of 0.88293 is critical for validating the current wave structure, and any breach of this level would require a reassessment of the wave count.
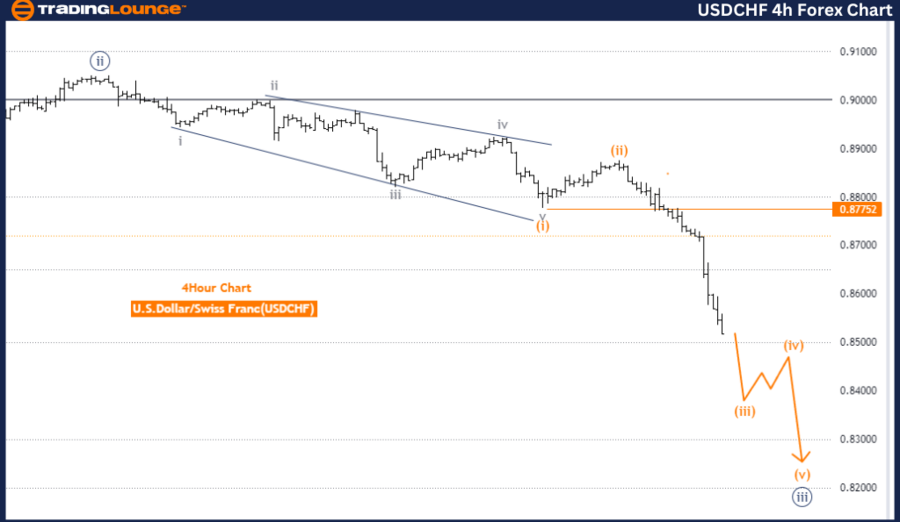
USD/CHF four-hour chart
Function: Trend
Mode: Impulsive
Structure: Orange wave 3
Position: Navy blue wave 3
Direction next higher degrees: Orange wave 4
Details: Orange wave 2 looking completed, now orange wave 3 is in play.
Wave cancel invalid level: 0.87752
The USDCHF Elliott Wave Analysis for the 4-hour chart reveals a trend function operating in an impulsive mode. The wave structure under consideration is identified as orange wave 3, which signifies a strong downward movement within the market. The current position is within navy blue wave 3, indicating that the market is experiencing the third wave of a larger degree trend.
In Elliott Wave theory, wave 3 is typically the most powerful and extended wave, suggesting a robust bearish phase for the USDCHF pair. After the completion of orange wave 3, the market is expected to transition into orange wave 4, which will be a corrective phase. This phase will temporarily counter the primary downward trend before resuming its upward trajectory.
The details highlight that orange wave 2 appears to be completed. This suggests that the market has finished its corrective phase and is now in the midst of orange wave 3. The completion of orange wave 2 indicates that the market has digested its previous movements and is ready for another strong bearish push. Orange wave 3, being an impulsive wave, typically brings significant gains and strong bearish momentum.
The wave cancel invalid level is set at 0.87752. This level is crucial for the validation of the current wave structure. If the USDCHF pair falls below this level, the existing wave count would be invalidated, meaning the anticipated wave pattern is no longer applicable. In such a scenario, a reassessment of the market’s direction and wave structure would be necessary.
In summary, the USDCHF Elliott Wave Analysis on the 4-hour chart indicates that the market is in the impulsive phase of orange wave 3, positioned within navy blue wave 3. The current phase suggests strong downward momentum, with a corrective phase expected to follow, represented by orange wave 4. The wave cancel invalid level of 0.87752 is critical for validating the current wave structure, and any breach of this level would require a reassessment of the wave count.
USD/CHF Elliott Wave technical analysis [Video]
Author

Peter Mathers
TradingLounge
Peter Mathers started actively trading in 1982. He began his career at Hoei and Shoin, a Japanese futures trading company.


