USD/CHF Elliott Wave technical analysis [Video]
![USD/CHF Elliott Wave technical analysis [Video]](https://editorial.fxstreet.com/images/Markets/Currencies/Majors/USDCHF/swiss-money-with-coins-ii-2022332_XtraLarge.jpg)
USD/CHF Elliott Wave technical analysis
Function: Counter Trend.
Mode: Corrective.
Position: Navy blue wave 2.
Structure: Gray wave 1.
Next lower degrees: Navy blue wave 3.
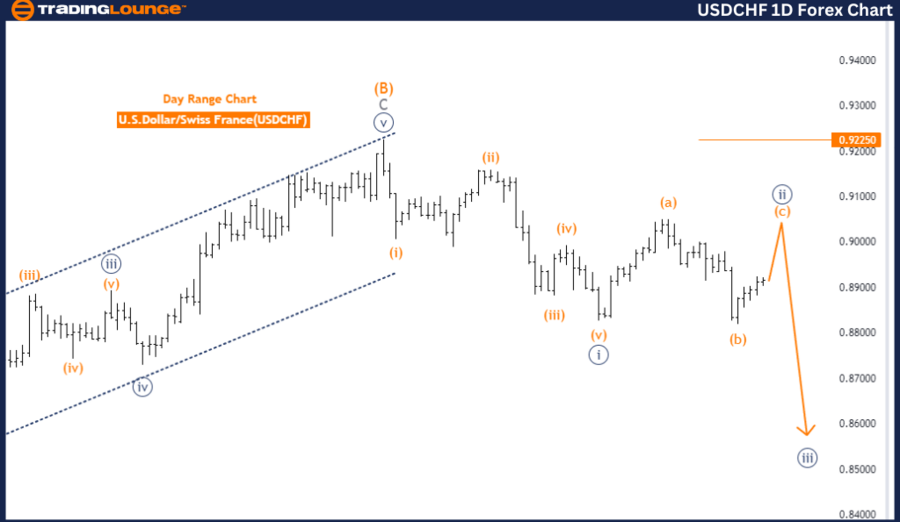
The USDCHF Elliott Wave Analysis on the daily chart offers a detailed examination of market behavior through Elliott Wave Theory. The current movement is identified as a counter trend, suggesting a corrective phase rather than a continuation of the dominant trend.
The mode of this wave is corrective, indicating the market is adjusting previous impulsive moves. Currently, the analysis focuses on navy blue wave 2, implying a significant correction after the initial impulsive wave, marked as gray wave 1.
As the market approaches the end of the navy blue wave 2 correction, the analysis points towards a transition into navy blue wave 3. This wave typically involves strong and directional price movements, indicating a significant market shift.
The ongoing navy blue wave 2 is forming a flat correction, a pattern characterized by sideways movement, suggesting indecision and a temporary balance between buyers and sellers. This phase is nearing its end, setting the stage for the next impulsive phase.
An important aspect of this analysis is the wave cancel invalid level at 0.92250. If the market moves below this point, the current wave analysis would be invalidated, requiring a reassessment of the wave structure.
Summary: The USDCHF day chart indicates a corrective phase, labeled as navy blue wave 2, following the impulsive gray wave 1. The next anticipated move is the transition into navy blue wave 3, an impulsive phase. The critical level for validating the current wave analysis is set at 0.92250.
USD/CHF day chart Elliott Wave analysis
USD/CHF four-hour chart Elliott Wave analysis
Function: Counter Trend.
Mode: Corrective.
Position: Orange wave C.
Structure: Navy blue wave 2.
Next lower degrees: Navy blue wave 3.
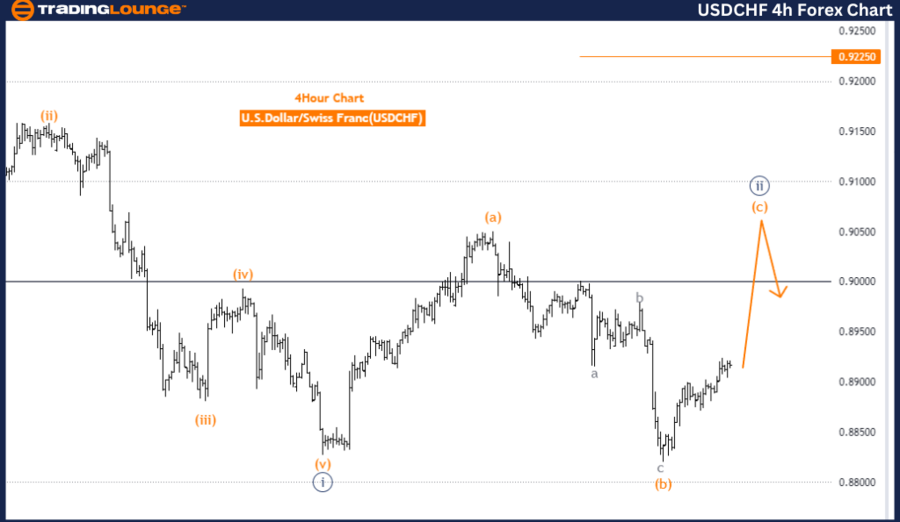
The USDCHF Elliott Wave Analysis on the 4-hour chart provides insight into market behavior using Elliott Wave Theory. The current market movement is classified as a counter trend, indicating a corrective phase rather than a continuation of the primary trend.
The current mode is corrective, showing the market is adjusting prior impulsive moves. The specific wave under analysis is orange wave C, part of a corrective sequence following the completion of orange wave B. This suggests the market has finished a corrective wave B and is now in the final leg of the correction with wave C.
The broader structure includes navy blue wave 2, typically a corrective wave following an initial impulsive wave 1, indicating the market is undergoing a significant correction after completing the first impulsive wave of a larger cycle.
The analysis points towards the next lower degrees, indicating the direction is towards navy blue wave 3. After the current corrective phase (navy blue wave 2) concludes, the market is expected to enter an impulsive phase identified as navy blue wave 3, often characterized by strong and directional price movements.
The current phase, orange wave C of 2, indicates the market is in the final stages of this correction before potentially resuming the main trend. An essential aspect of this analysis is the wave cancellation invalid level at 0.92250. If the market falls below this point, the current wave analysis would be invalidated, requiring a reevaluation of the wave structure.
Summary: The USDCHF 4-hour chart analysis indicates the market is in a corrective phase, labeled as orange wave C within navy blue wave 2. The next expected movement is a transition into navy blue wave 3, marking an impulsive phase. The critical level for validating the current wave analysis is set at 0.92250.
USD/CHF Elliott Wave technical analysis [Video]
Author

Peter Mathers
TradingLounge
Peter Mathers started actively trading in 1982. He began his career at Hoei and Shoin, a Japanese futures trading company.


