USD/CHF Elliott Wave technical analysis [Video]
![USD/CHF Elliott Wave technical analysis [Video]](https://editorial.fxstreet.com/images/Markets/Currencies/Majors/USDCHF/swiss-money-with-coins-ii-2022332_XtraLarge.jpg)
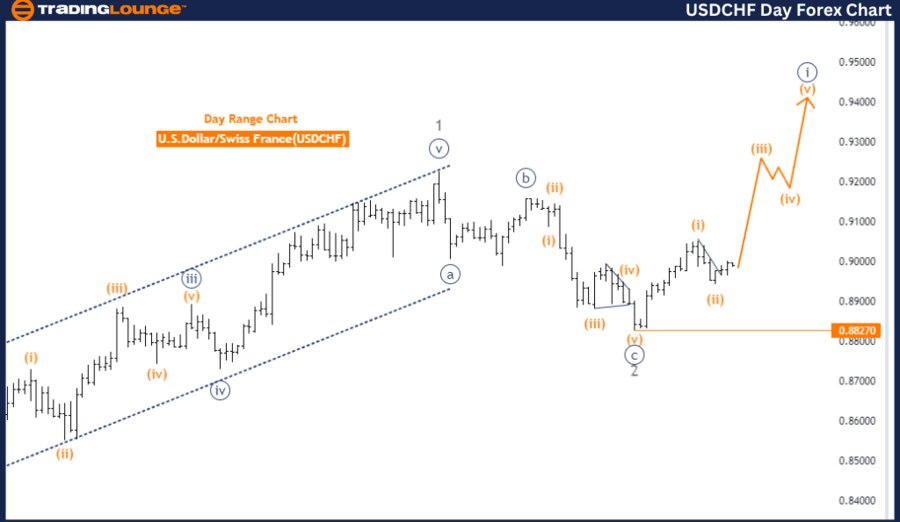
USD/CHF Elliott Wave analysis - Daily chart
Overview
The USDCHF Elliott Wave analysis on the daily chart provides insight into the current market trend and wave structure.
Trend identification
-
Function: Trend.
-
Mode: Impulsive.
-
Structure: Orange wave 3.
-
Position: Navy blue wave 1.
Current analysis
-
Details: Orange wave 2 appears to be completed. Currently, orange wave 3 is in play.
-
Invalidation Level: 1.88270.
Key points
-
Impulsive Trend: The analysis identifies the trend as impulsive, indicating strong directional movements.
-
Wave Structure: The focus is on orange wave 3 within the Elliott Wave structure. The current position is at navy blue wave 1, marking the start of a new impulsive sequence.
-
Next Phase: The next lower degree direction points to orange wave 4, suggesting a corrective phase after the completion of the current impulsive wave 3.
Detailed analysis
-
Orange Wave 2 Completion: The completion of orange wave 2 signifies the end of a corrective phase. The market is now in orange wave 3, characterized by strong, decisive movements.
-
Wave 3 Characteristics: Orange wave 3 indicates an active phase within the impulsive trend, reflecting robust market movements.
-
Invalidation Level: The wave cancel invalid level is set at 1.88270. If the market price falls below this level, the current wave analysis would be invalid.
Conclusion
The USDCHF daily chart analysis highlights an impulsive trend within the Elliott Wave framework. The market has transitioned from the completion of orange wave 2 into the active phase of orange wave 3, indicating strong market movements. The next expected phase is orange wave 4, following the completion of the current impulsive wave. The invalidation level at 1.88270 is critical for confirming the current wave structure.
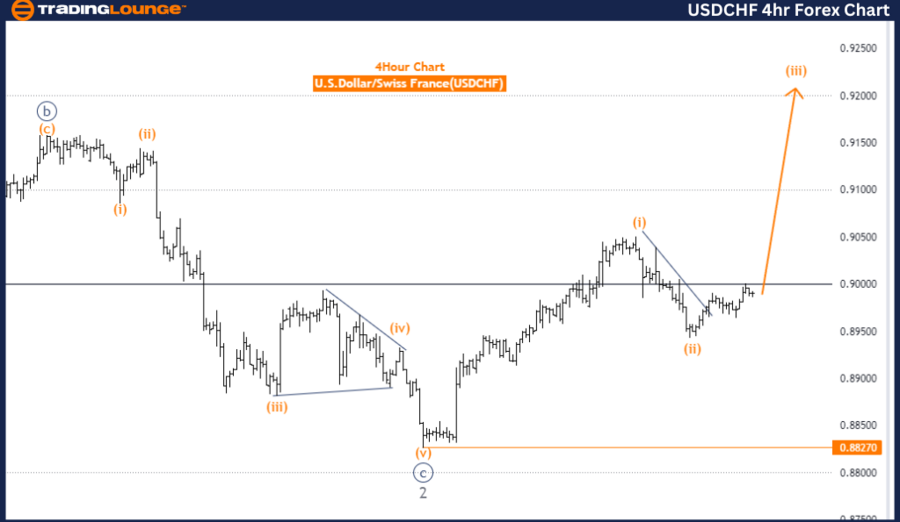
USD/CHF Elliott Wave analysis - Four-hour chart
Overview
The USDCHF Elliott Wave analysis on the 4-hour chart provides insights into the current market trend and wave structure.
Trend identification
-
Function: Trend.
-
Mode: Impulsive.
-
Structure: Orange wave 3.
-
Position: Navy blue wave 1.
Current analysis
-
Details: Orange wave 2 appears to be completed. Currently, orange wave 3 is in play.
-
Invalidation Level: 1.88270.
Key points
-
Impulsive Trend: The analysis identifies the trend as impulsive, indicating strong directional movements.
-
Wave Structure: The focus is on orange wave 3 within the Elliott Wave structure. The current position is at navy blue wave 1, marking the start of a new impulsive sequence.
-
Next Phase: The next higher degree direction points to the continuation of orange wave 3, suggesting ongoing impulsive movements.
Detailed analysis
-
Orange Wave 2 Completion: The completion of orange wave 2 signifies the end of a corrective phase. The market is now in orange wave 3, characterized by strong, decisive movements.
-
Wave 3 Characteristics: Orange wave 3 indicates an active phase within the impulsive trend, reflecting robust market movements.
-
Invalidation Level: The wave cancel invalid level is set at 1.88270. If the market price falls below this level, the current wave analysis would be invalid.
Conclusion
The USDCHF 4-hour chart analysis highlights an impulsive trend within the Elliott Wave framework. The market has transitioned from the completion of orange wave 2 into the active phase of orange wave 3, indicating strong market movements. The ongoing impulsive trend is expected to continue with significant directional movements. The invalidation level at 1.88270 is critical for confirming the current wave structure.
USD/CHF Elliott Wave technical analysis [Video]
Author

Peter Mathers
TradingLounge
Peter Mathers started actively trading in 1982. He began his career at Hoei and Shoin, a Japanese futures trading company.


