USD/CHF Elliott Wave technical analysis [Video]
![USD/CHF Elliott Wave technical analysis [Video]](https://editorial.fxstreet.com/images/Markets/Currencies/Majors/USDCHF/coins-and-notes-from-switzerland-17730378_XtraLarge.jpg)
USD/CHF Elliott Wave technical analysis
Function: Trend.
Mode: Impulsive.
Structure: Navy blue wave 1.
Position: Grey wave 3
Direction next higher degrees: Navy blue wave 1(started).
Details: Grey wave 2 looking completed, now Navy blue wave 1 of grey wave 3 is in play.
Wave cancel invalid level: 0.88270.
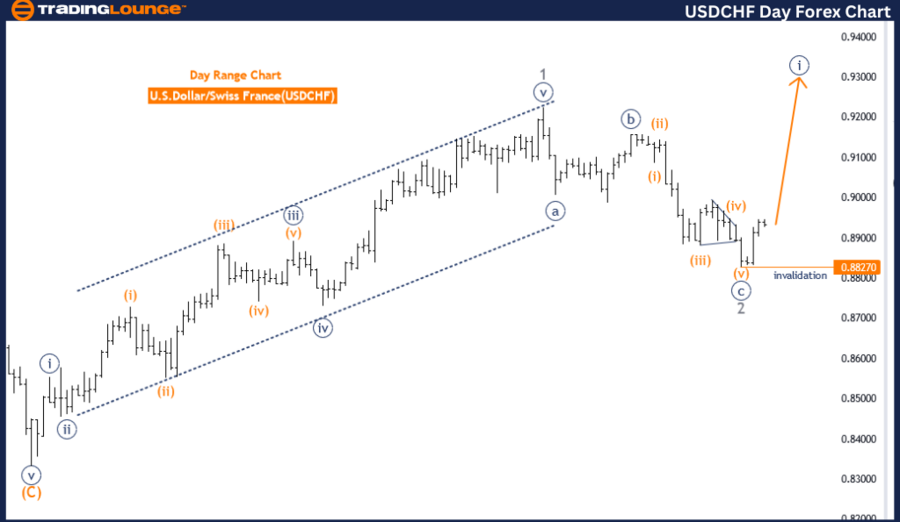
The USDCHF Elliott Wave analysis on the day chart focuses on the technical aspects of the market trend using the Elliott Wave theory. The function of this analysis is to identify and understand the trend, which is described as impulsive. This indicates that the market is in an upward movement driven by a series of impulse waves.
The structure currently under examination is Navy blue wave 1, which marks the initial phase of this impulsive trend. The position within this trend is identified as Gray wave 3, suggesting that the market has progressed through Gray wave 2 and is now advancing into Gray wave 3.
The direction for the next higher degrees is indicated as Navy blue wave 1, which has already started. This means that the initial impulsive wave (Navy blue wave 1) is underway within the larger structure of Gray wave 3. This wave is expected to continue driving the market upward, following the completion of the previous corrective phase (Gray wave 2).
Detailed observations within this analysis point out that Gray wave 2 appears to be completed. This sets the stage for the beginning of Navy blue wave 1 of Gray wave 3, indicating a new phase of market advancement. This transition marks a critical point in the Elliott Wave structure, suggesting a continuation of the upward trend.
An essential aspect of this analysis is the wave cancel invalid level, set at 0.88270. This level is crucial for validating the current wave count. If the market price falls below this threshold, it would invalidate the current wave structure, necessitating a reassessment of the wave count and potentially altering the market outlook.
In summary, the USDCHF day chart analysis identifies the market as being in an impulsive upward trend, with Navy blue wave 1 currently in play within the larger Gray wave 3 structure. Following the completion of Gray wave 2, the market is expected to continue its upward trajectory. The wave cancel invalid level at 0.88270 is a key indicator for confirming the current wave structure and guiding future market predictions.
USD/CHF Elliott Wave four-hour chart
Function: Trend.
Mode: Corrective.
Structure: Orange wave 2.
Position: Navy blue wave 1.
Direction next higher degrees: Orange wave 3.
Details: Orange wave 1 looking completed, now orange wave 2 is in play as correction.
Wave cancel invalid level: 0.88270
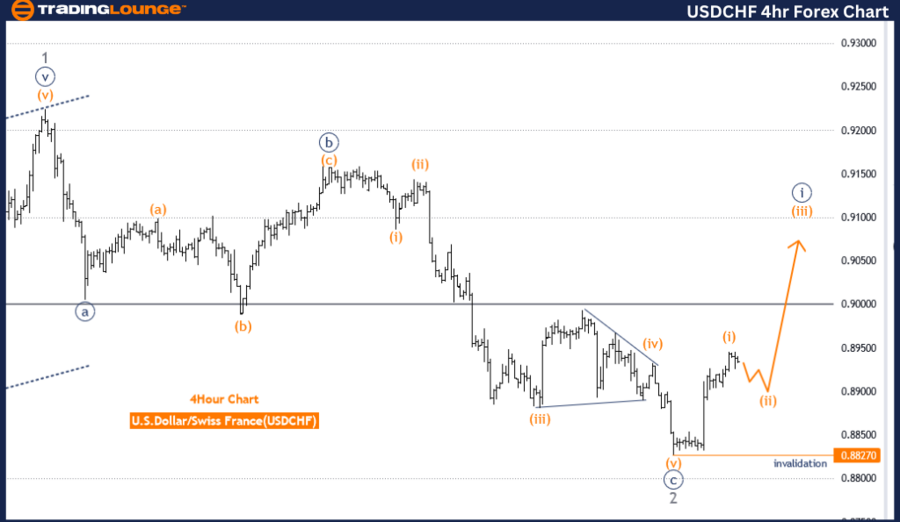
The USDCHF Elliott Wave analysis on the day chart provides a technical assessment using the Elliott Wave theory, focusing on the current market trend. The analysis identifies the function as a trend with a corrective mode, indicating that the market is currently undergoing a corrective phase within an overall upward trend.
In this context, the structure being examined is orange wave 2, which follows the completion of orange wave 1. The position within this corrective phase is designated as navy blue wave 1, showing that the initial impulse wave has completed, and the market is now in a corrective wave.
The direction for the next higher degrees is projected to be orange wave 3, suggesting that after the completion of the current correction, the market is expected to resume its upward movement. This implies that once orange wave 2 concludes, orange wave 3 will begin, continuing the overall bullish trend.
The details provided in the analysis highlight that orange wave 1 appears to be completed. Now, orange wave 2 is in play as a correction, indicating a temporary retracement before the market continues its upward trajectory. The corrective phase represented by orange wave 2 is essential for the market to consolidate and prepare for the next impulsive wave.
A critical component of this analysis is the wave cancel invalid level, set at 0.88270. This level serves as a crucial threshold for validating the current wave count and ensuring the accuracy of the Elliott Wave structure. If the market price moves below this level, it would invalidate the current wave analysis, necessitating a reevaluation of the wave count and potentially altering the market outlook.
In summary, the USDCHF day chart analysis suggests that the market is currently in a corrective phase, represented by orange wave 2, following the completion of orange wave 1. This correction is expected to be temporary, with the market anticipated to resume its upward trend in orange wave 3. The wave cancel invalid level at 0.88270 is a key indicator for confirming the validity of the current wave structure and guiding future market predictions.
USD/CHF Elliott Wave technical analysis [Video]
Author

Peter Mathers
TradingLounge
Peter Mathers started actively trading in 1982. He began his career at Hoei and Shoin, a Japanese futures trading company.


