USD/CHF Elliott Wave technical analysis [Video]
![USD/CHF Elliott Wave technical analysis [Video]](https://editorial.fxstreet.com/images/Markets/Currencies/Majors/USDCHF/coins-of-switzerland-52729768_XtraLarge.jpg)
USD/CHF Elliott Wave technical analysis
Function: Trend.
Mode: impulsive.
Structure: Blue wave 5.
Position: Black wave 1.
Direction next lower degrees: Black wave 2.
Details: Blue wave 4 of 1 looking completed at 0.90085, now blue wave 5 of 1 is in play.
Wave cancel invalid level: 0.88948
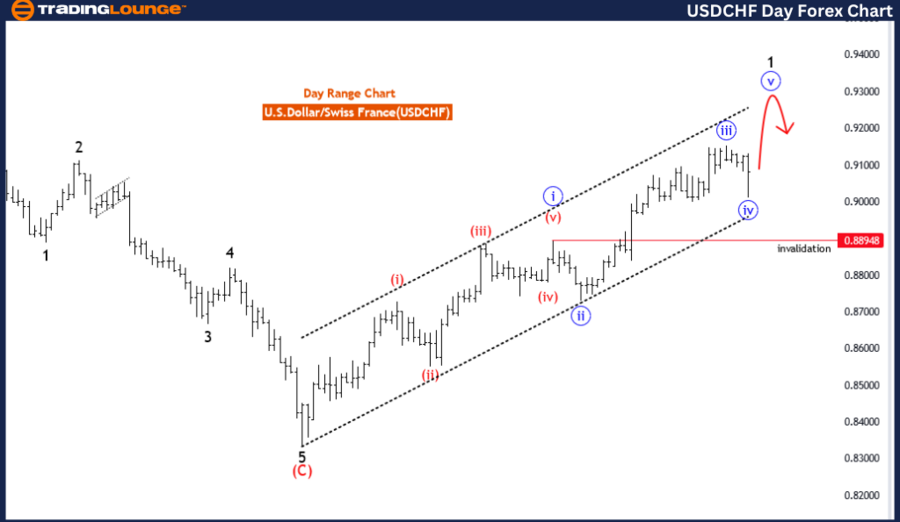
The USD/CHF Elliott Wave Analysis for the day chart provides insights into the potential price movements of the U.S. Dollar against the Swiss Franc, utilizing Elliott Wave principles for technical analysis.
Identified as a "Trend," the analysis suggests that the prevailing market direction aligns with the broader trend, indicating potential opportunities for traders to participate in the direction of the trend.
Described as "Impulsive" in mode, the analysis indicates that the current market movement exhibits characteristics of an impulsive wave pattern. This implies that the price is likely advancing in the direction of the trend with strong momentum, potentially offering trading opportunities for trend-following strategies.
The "STRUCTURE" is labeled as "blue wave 5," providing clarity on the current phase of the Elliott Wave cycle. This helps traders understand the stage of the trend and anticipate potential reversal points or continuation patterns.
Positioned as "black wave 1," the analysis highlights the specific phase of the Elliott Wave cycle within the current trend. This indicates that the market has completed a wave cycle and is potentially starting a new wave cycle in the direction of the trend.
In the "DIRECTION NEXT LOWER DEGREES" section, the analysis mentions "black wave 2," suggesting the potential direction for the next lower-degree wave within the Elliott Wave cycle. This implies that the market may experience a corrective wave before continuing its upward movement.
The "DETAILS" section notes that "blue wave 4 of 1 looking completed at 0.90085, now blue wave 5 of 1 is in play." This suggests that the corrective wave within the current wave cycle has potentially ended, and the market is now resuming its upward movement. Additionally, the wave cancel level is identified at 0.88948, providing a reference point for invalidating the wave count. Traders can utilize this information to assess potential trading opportunities and manage risk effectively.
USD/CHF day chart
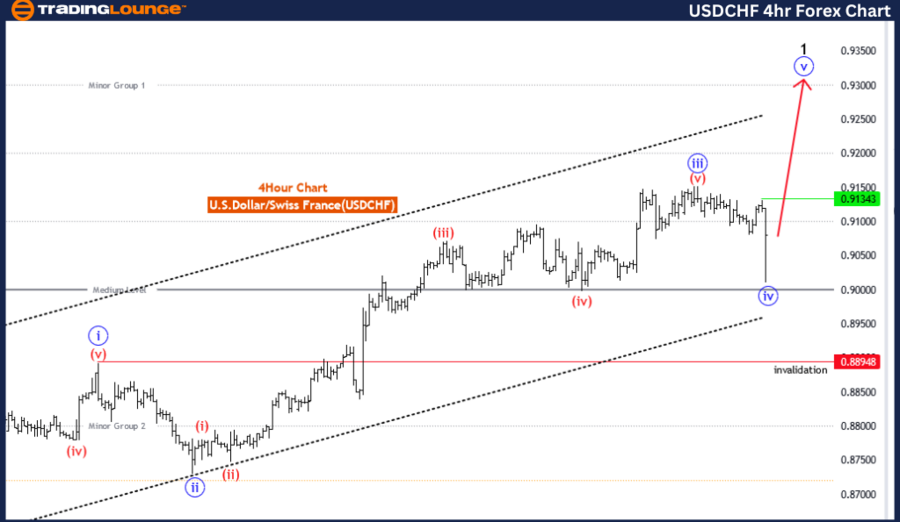
USD/CHF four-hour chart
Function: Trend.
Mode: impulsive.
Structure: Blue wave 5.
Position: Black wave 1.
Direction next higher degrees: Blue wave 5 (may started)
Details: Blue wave 4 of 1 looking completed at 0.90085, now blue wave 5 of 1 is in play.
Wave cancel invalid level: 0.88948
The USD/CHF Elliott Wave Analysis for the 4-hour chart provides insights into the potential price movements of the U.S. Dollar against the Swiss Franc, employing Elliott Wave principles for technical analysis.
Identified as a "Trend," the analysis suggests that the prevailing market direction aligns with the broader trend, indicating potential opportunities for traders to participate in the direction of the trend.
Described as "Impulsive" in mode, the analysis indicates that the current market movement exhibits characteristics of an impulsive wave pattern. This implies that the price is likely advancing in the direction of the trend with strong momentum, potentially offering trading opportunities for trend-following strategies.
The "STRUCTURE" is labeled as "blue wave 5," providing clarity on the current phase of the Elliott Wave cycle. This helps traders understand the stage of the trend and anticipate potential reversal points or continuation patterns.
Positioned as "black wave 1," the analysis highlights the specific phase of the Elliott Wave cycle within the current trend. This indicates that the market has completed a wave cycle and is potentially starting a new wave cycle in the direction of the trend.
In the "DIRECTION NEXT HIGHER DEGREES" section, the analysis mentions "blue wave 5 (may have started)," suggesting the potential direction for the next higher-degree wave within the Elliott Wave cycle. This implies that the market may continue its upward movement, supporting the overall bullish trend.
The "DETAILS" section notes that "blue wave 4 of 1 looking completed at 0.90085, now blue wave 5 of 1 is in play." This suggests that the corrective wave within the current wave cycle has potentially ended, and the market is now resuming its upward movement. Additionally, the wave cancel level is identified at 0.88948, providing a reference point for invalidating the wave count. Traders can utilize this information to assess potential trading opportunities and manage risk effectively.
USD/CHF Elliott Wave technical analysis [Video]
Author

Peter Mathers
TradingLounge
Peter Mathers started actively trading in 1982. He began his career at Hoei and Shoin, a Japanese futures trading company.


