USD/CHF Elliott Wave analysis favors selling bounces
Today, we will discuss the future path for the USDCHF currency pair. The recent breakout confirmed the bearish bias we shared with members of Elliottwave-Forecast. So, what is next for this pair in the coming weeks?
On April 29, 2024, the pair completed the medium-term bullish corrective cycle that began in December 2023. Since then, it has continued to decline and is about to break below the second low, continuing the bearish sequence. Prior to this breakdown, we shared the weekly chart below with members to show the long-term path.
USD/CHF weekly chart – 07.14.2024
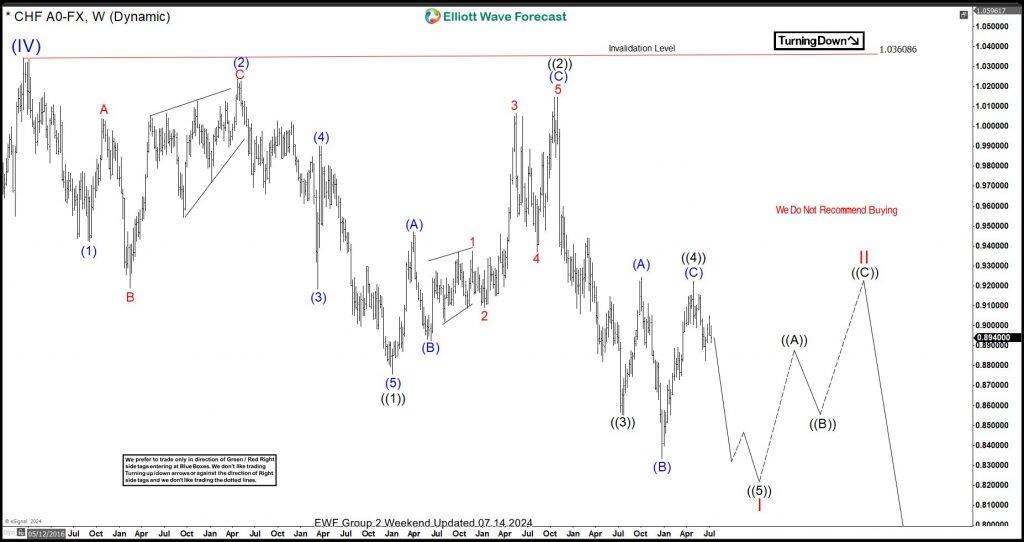
On July 14, 2024, we shared the chart above with members, highlighting the high likelihood of a bearish run from late April 2024. The weekly chart shows that the price completed the supercycle 4th wave – wave (IV) – in December 2016. Therefore, it began wave (V) from that point. From the top of December 2016, we laid out the path for wave I of (V). Price completed waves ((1)), ((2)), ((3)), and ((4)) of I in January 2021, October 2022, July 2023, and April 2024, respectively. Thus, from the peak of April 2024, we called for the last leg – wave ((5)) of I – to continue downwards and break below the December 2023 low. Therefore, members understood the direction we had our bias for in the weeks to follow. Additionally, we zoomed in on the H4 and H1 charts to monitor this development and trade along when there are bounces.
USD/CHF four-hour chart – 07.16.2024
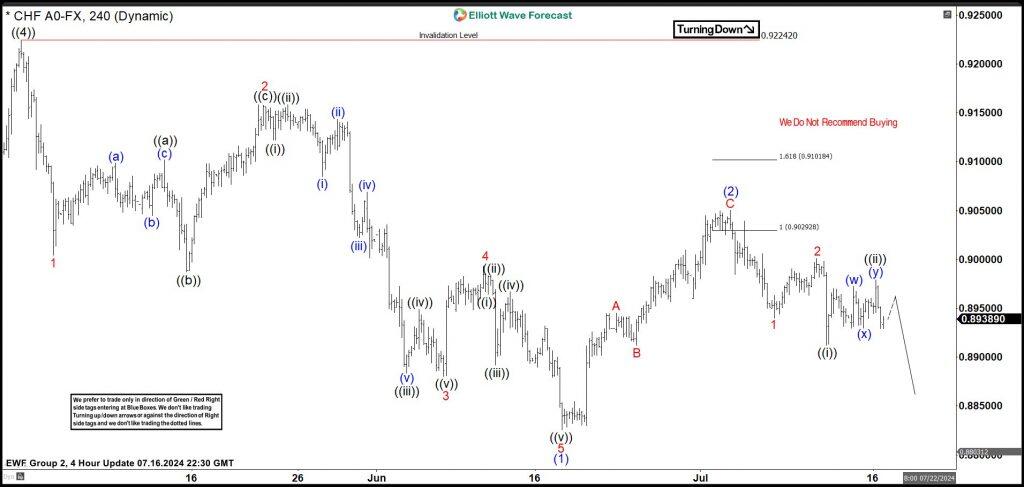
A few days later, we shared this H4 chart with members. A week before this time, we had recognized the end of wave (1) of ((5)) and monitored the development of the corresponding wave (2) correction. Since we wanted to sell bounces, we identified 0.9029-0.9101 as the extreme where wave (2) should end and wave (3) downwards should begin. The price respected the extreme and turned downwards for wave 1-2-((i))-((ii)) nesting. We called for a breakdown for wave ((iii)) of 3 as part of the larger degree wave (3). Eventually, the pair broke down below the start of wave (1), confirming the market’s commitment to the path we expected.
USD/CHF four-hour chart- 07.17.2024
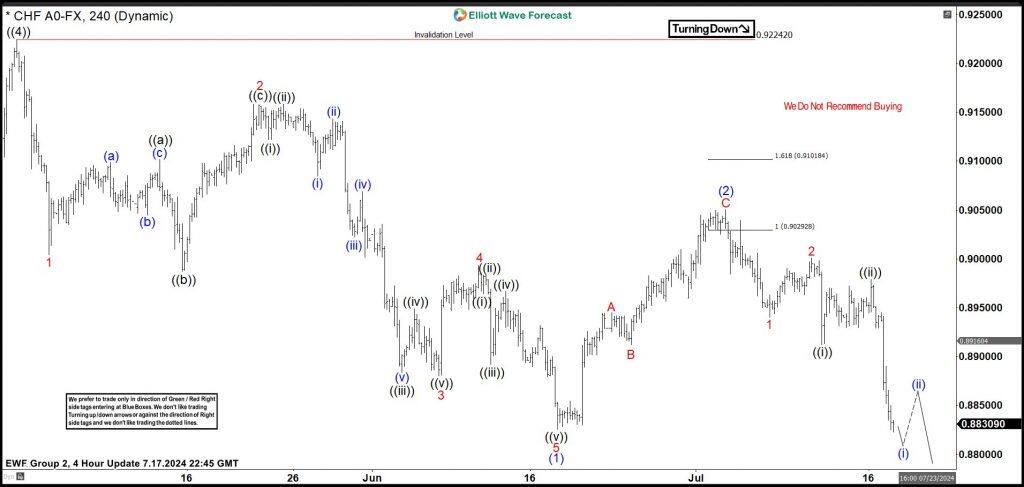
A day later, on July 17, 2024, we shared the H4 chart above with members. As the chart shows, wave ((iii)) is now in progress as the price seeks to break below wave (i) properly. The current sharp decline is wave (i) of ((iii)). The idea is to sell the bounces on both the H1/30Mins and H4 charts. Next, on the shorter cycles, we aim to sell for wave (iii) of ((iii)) after the price completes the next bounce for wave (ii) in 3, 7, 11 swings at our proprietary blue box.
In conclusion, it’s safe and profitable to trade in the direction of the trend. As the saying goes, “the trend is your friend.” Therefore, there is no need to trade against the trend when it’s not broken. As for USDCHF, we want to remain sellers and not buyers until this current bearish cycle is over.
Author

Elliott Wave Forecast Team
ElliottWave-Forecast.com


