|

USD/CHF calling the rally after Elliott Wave double three pattern

In this technical article we’re going to take a look at the Elliott Wave charts charts of USDCHF Forex pair published in members area of the website.  Our members know USDHCF recently made a clear three-wave correction. The pull back completed as Elliott Wave Double Three pattern and made rally toward new highs as expected. In this discussion, we’ll break down the Elliott Wave pattern and forecast.

Elliott Wave double three pattern

Double three is the common pattern in the market , also known as 7 swing structure. It’s a reliable pattern which is giving us good trading entries with clearly defined invalidation levels.
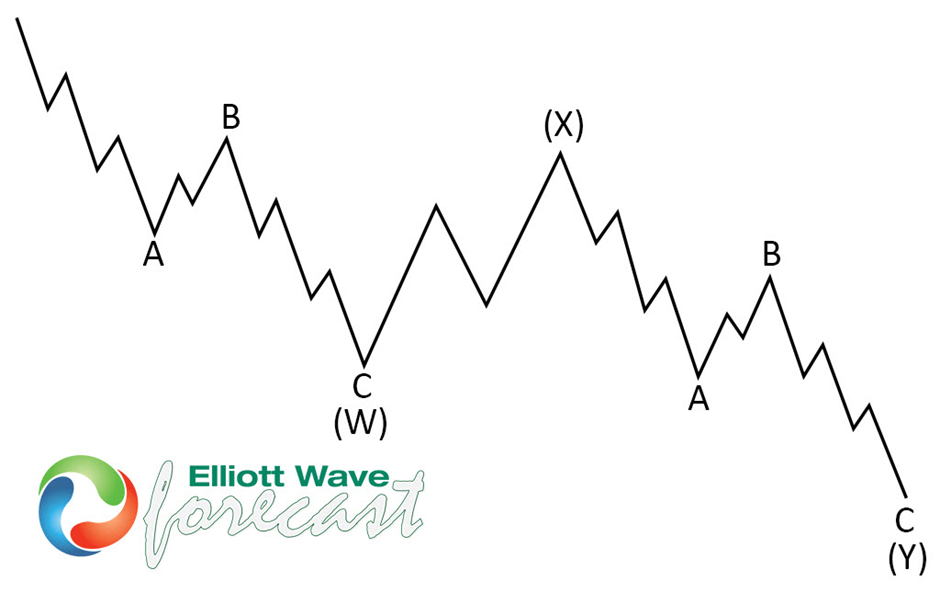
The picture below presents what Elliott Wave Double Three pattern looks like. It has (W),(X),(Y) labeling and 3,3,3 inner structure, which means all of these 3 legs are corrective sequences. Each (W) and (Y) are made of 3 swings , they’re having A,B,C structure in lower degree, or alternatively they can have W,X,Y labeling.

Chart

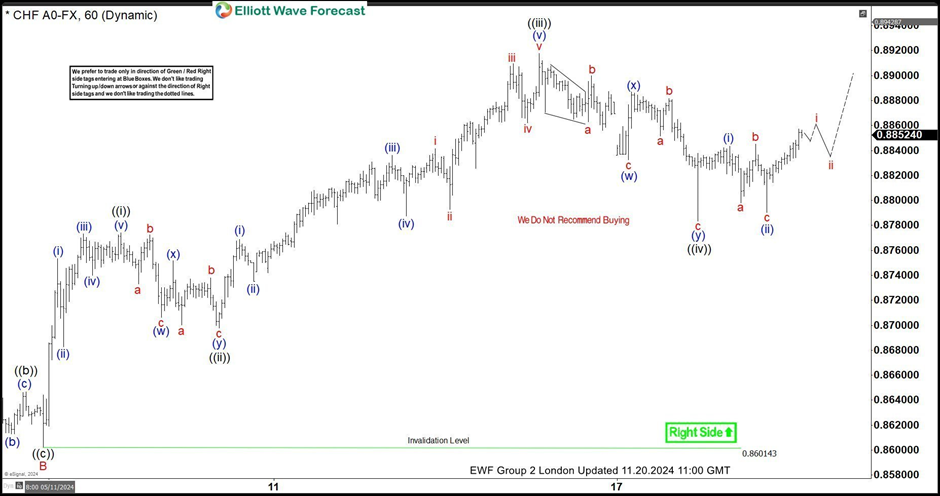
USD/CHF Elliott Wave one hour chart 11.20.2024

USDCHF is showing higher high sequences in the cycle from the September 6th low , suggesting further strength ahead.  The structure of this pullback shows clear 7 swings – Double Three Pattern.  The first leg, shows a clear 3-wave structure a,b,c red, followed by a 3-wave bounce in (x) blue. We can also count 3 swings in (y) blue leg. We advise against selling $USDCHF and instead favor the long side. While the price stays above ((iv)) black low, we expect to see further rally toward new highs.

Chart

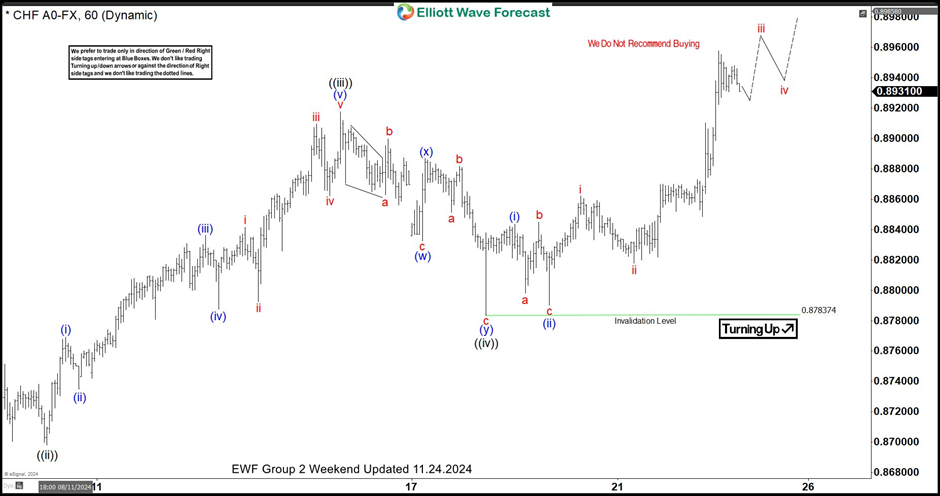
USD/CHF Elliott Wave one hour  chart 11.24.2024

USDCHF found buyers as expected. The forex pair has reacted strongly and eventually we got a break toward new highs. Now, intraday pull backs should ideally keep finding buyers as far as 0.8783 pivot holds.

Chart

Author

Elliott Wave Forecast Team

Elliott Wave Forecast Team

ElliottWave-Forecast.com

More from Elliott Wave Forecast Team
Share:

Editor's Picks

EUR/USD hits two-day highs near 1.1820

EUR/USD picks up pace and reaches two-day tops around 1.1820 at the end of the week. The pair’s move higher comes on the back of renewed weakness in the US Dollar amid growing talk that the Fed could deliver an interest rate cut as early as March. On the docket, the flash US Consumer Sentiment improves to 57.3 in February.

GBP/USD reclaims 1.3600 and above

GBP/USD reverses two straight days of losses, surpassing the key 1.3600 yardstick on Friday. Cable’s rebound comes as the Greenback slips away from two-week highs in response to some profit-taking mood and speculation of Fed rate cuts. In addition, hawkish comments from the BoE’s Pill are also collaborating with the quid’s improvement.

Gold climbs further, focus is back to 45,000

Gold regains upside traction and surpasses the $4,900 mark per troy ounce at the end of the week, shifting its attention to the critical $5,000 region. The move reflects a shift in risk sentiment, driving flows back towards traditional safe haven assets and supporting the yellow metal.

Crypto Today: Bitcoin, Ethereum, XRP rebound amid risk-off, $2.6 billion liquidation wave

Bitcoin edges up above $65,000 at the time of writing on Friday, as dust from the recent macro-triggered sell-off settles. The leading altcoin, Ethereum, hovers above $1,900, but resistance at $2,000 caps the upside. Meanwhile, Ripple has recorded the largest intraday jump among the three assets, up over 10% to $1.35.

Three scenarios for Japanese Yen ahead of snap election

The latest polls point to a dominant win for the ruling bloc at the upcoming Japanese snap election. The larger Sanae Takaichi’s mandate, the more investors fear faster implementation of tax cuts and spending plans. 

XRP rally extends as modest ETF inflows support recovery

Ripple is accelerating its recovery, trading above $1.36 at the time of writing on Friday, as investors adjust their positions following a turbulent week in the broader crypto market. The remittance token is up over 21% from its intraday low of $1.12.