USD/CAD: The stage is set for the Bear
USD/CAD has been bearish on the daily chart. The pair produced three consecutive bearish candles after having rejection twice at a level of resistance. The price breached the neckline level as well as the last swing low, and it is trading below the level now. Major intraday charts look good for the sellers as well. Thus, the pair may head towards the South further by producing another bearish candle on the daily chart.
Chart 1 USD/CAD Daily Chart

The first candle came out as a bearish doji candle followed by a huge bearish Marubozu candle. The second candle breached the level of 1.3210, which is the level of the last swing low. Today’s intraday price action suggests that the price is having an upward correction. Upon finding its resistance, it may head towards the South. If that happens and the price makes a breakout at yesterday’s lowest low, the daily traders may go short on the pair. The price may find its next resistance at the level of 1.3125 first and then 1.3050.
Let us now have a look at the major intraday charts.
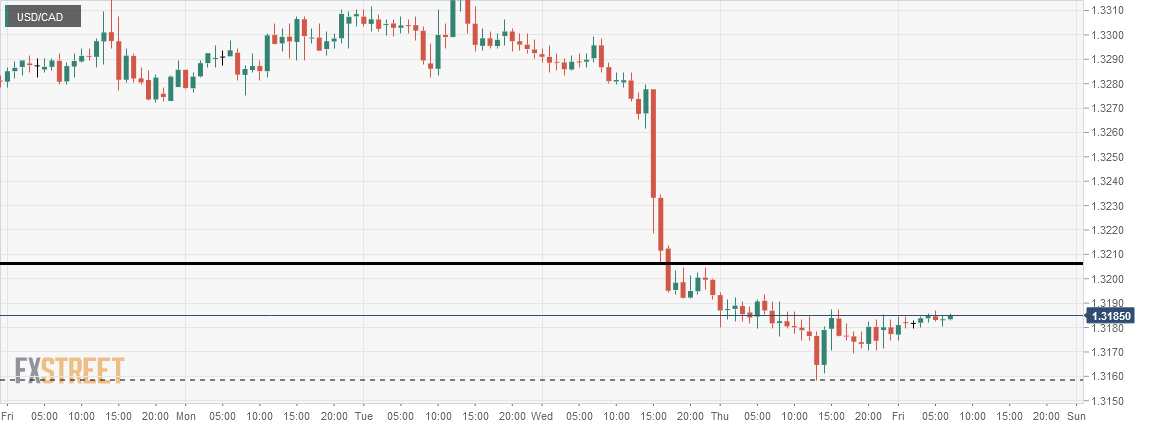
Chart 2 USD/CAD H4 Chart
The H4 chart shows that the price after breaching the last swing low headed towards the South with less bearish momentum. It has had a bounce at the level of 1.3160, where it had a bounce earlier. Since the price has had its second bounce, it may head towards the North for a while to find its resistance. The level of 1.3210 may hold the price as resistance. If the level produces an H4 bearish reversal candle and the price breaches the level of 1.3160, the H4 sellers may get themselves engaged in selling the pair aggressively.
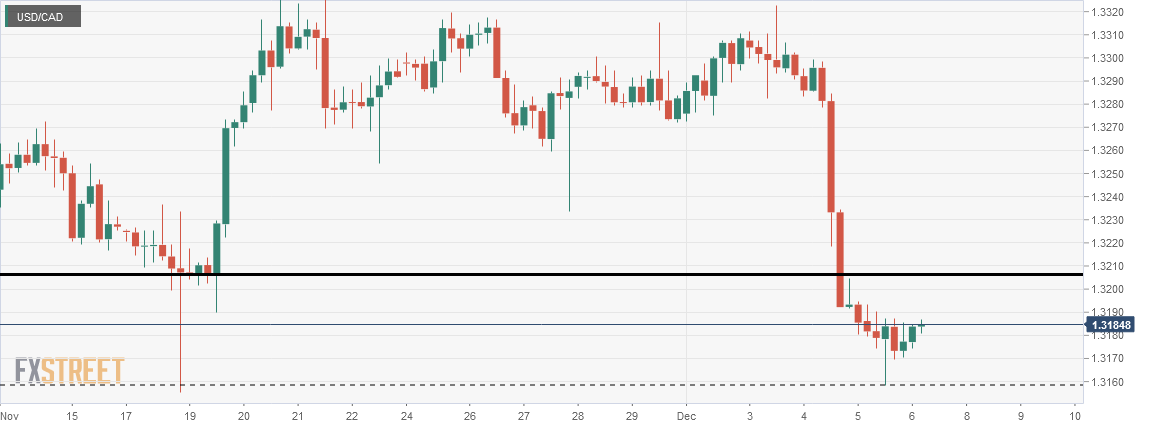
Chart 3 USD/CAD H1 Chart
The H1 chart suggests that the price has been searching for its resistance. The daily resistance seems a bit far, though. The price may find its resistance and produce an H1 bearish reversal candle at the level of 1.3190. This is where the H1 chart made its last swing high. The fact remains that the price is to breach the same support, which is at 1.3160, to get the H1 traders to go short on the pair.
All three charts look good for the sellers. A bearish momentum followed by a breakout at yesterday’s lowest low may create a bearish wave for the sellers to ride and make some green pips.
Author

EagleFX Team
EagleFX
EagleFX Team is an international group of market analysts with skills in fundamental and technical analysis, applying several methods to assess the state and likelihood of price movements on Forex, Commodities, Indices, Metals and


