USD/CAD Price Forecast: Bulls have the upper hand despite corrective slide, 1.3800 holds the key
- USD/CAD drifts lower on Thursday and is pressured by a combination of factors.
- Rising Oil prices underpin the Loonie and weigh on the pair amid a softer USD.
- The BoC’s outsized rate cut and bets for a less aggressive Fed easing limit losses.
The USD/CAD pair attracts some sellers on Thursday and moves away from its highest level since early August, around the 1.3860-1.3865 region touched in reaction to the Bank of Canada's (BoC) oversized rate cut the previous day. The Canadian central bank took an aggressive step and decided to lower its key benchmark interest rate by 50 basis points (bps) for the first time since the COVID-19 pandemic. Moreover, the recent decline in Canada’s annual inflation rate to 1.6% in September, along with signs that the economy and labour markets are weakening, paves the way for aggressive interest rate cuts going forward. This, in turn, weighed on the Canadian Dollar (USD) and provided a goodish intraday lift to the currency pair.
That said, a fresh leg up in Crude Oil prices, bolstered by persistent geopolitical risks stemming from the ongoing conflicts in the Middle East, offers some support to the commodity-linked Loonie. Apart from this, a modest US Dollar (USD) pullback, from its highest level since July 30 touched on Wednesday, is seen exerting some downward pressure on the USD/CAD pair. The US Treasury bond yields retreat from a three-month peak, which, along with a stable performance across the global equity markets, prompts some profit-taking around the safe-haven buck. That said, bets for smaller rate cuts by the Federal Reserve (Fed) and deficit-spending concerns after the US election should limit the downside for the US bond yields.
Investors remain concerned that the spending plans of both Vice President Kamala Harris and the Republican nominee Donald Trump will further increase the deficit. Furthermore, rising odds of former President Donald Trump winning the November 5 US Presidential election fuel speculations about the launch of potentially inflation-generating tariffs. This might continue to push the US bond yields higher and favors the USD bulls, supporting prospects for the emergence of some dip-buying around the USD/CAD pair. Traders now look forward to the release of the flash US PMI prints. Apart from this, the US bond yields will influence the USD, which, along with Oil price dynamics, might produce short-term trading opportunities.
Technical Outlook
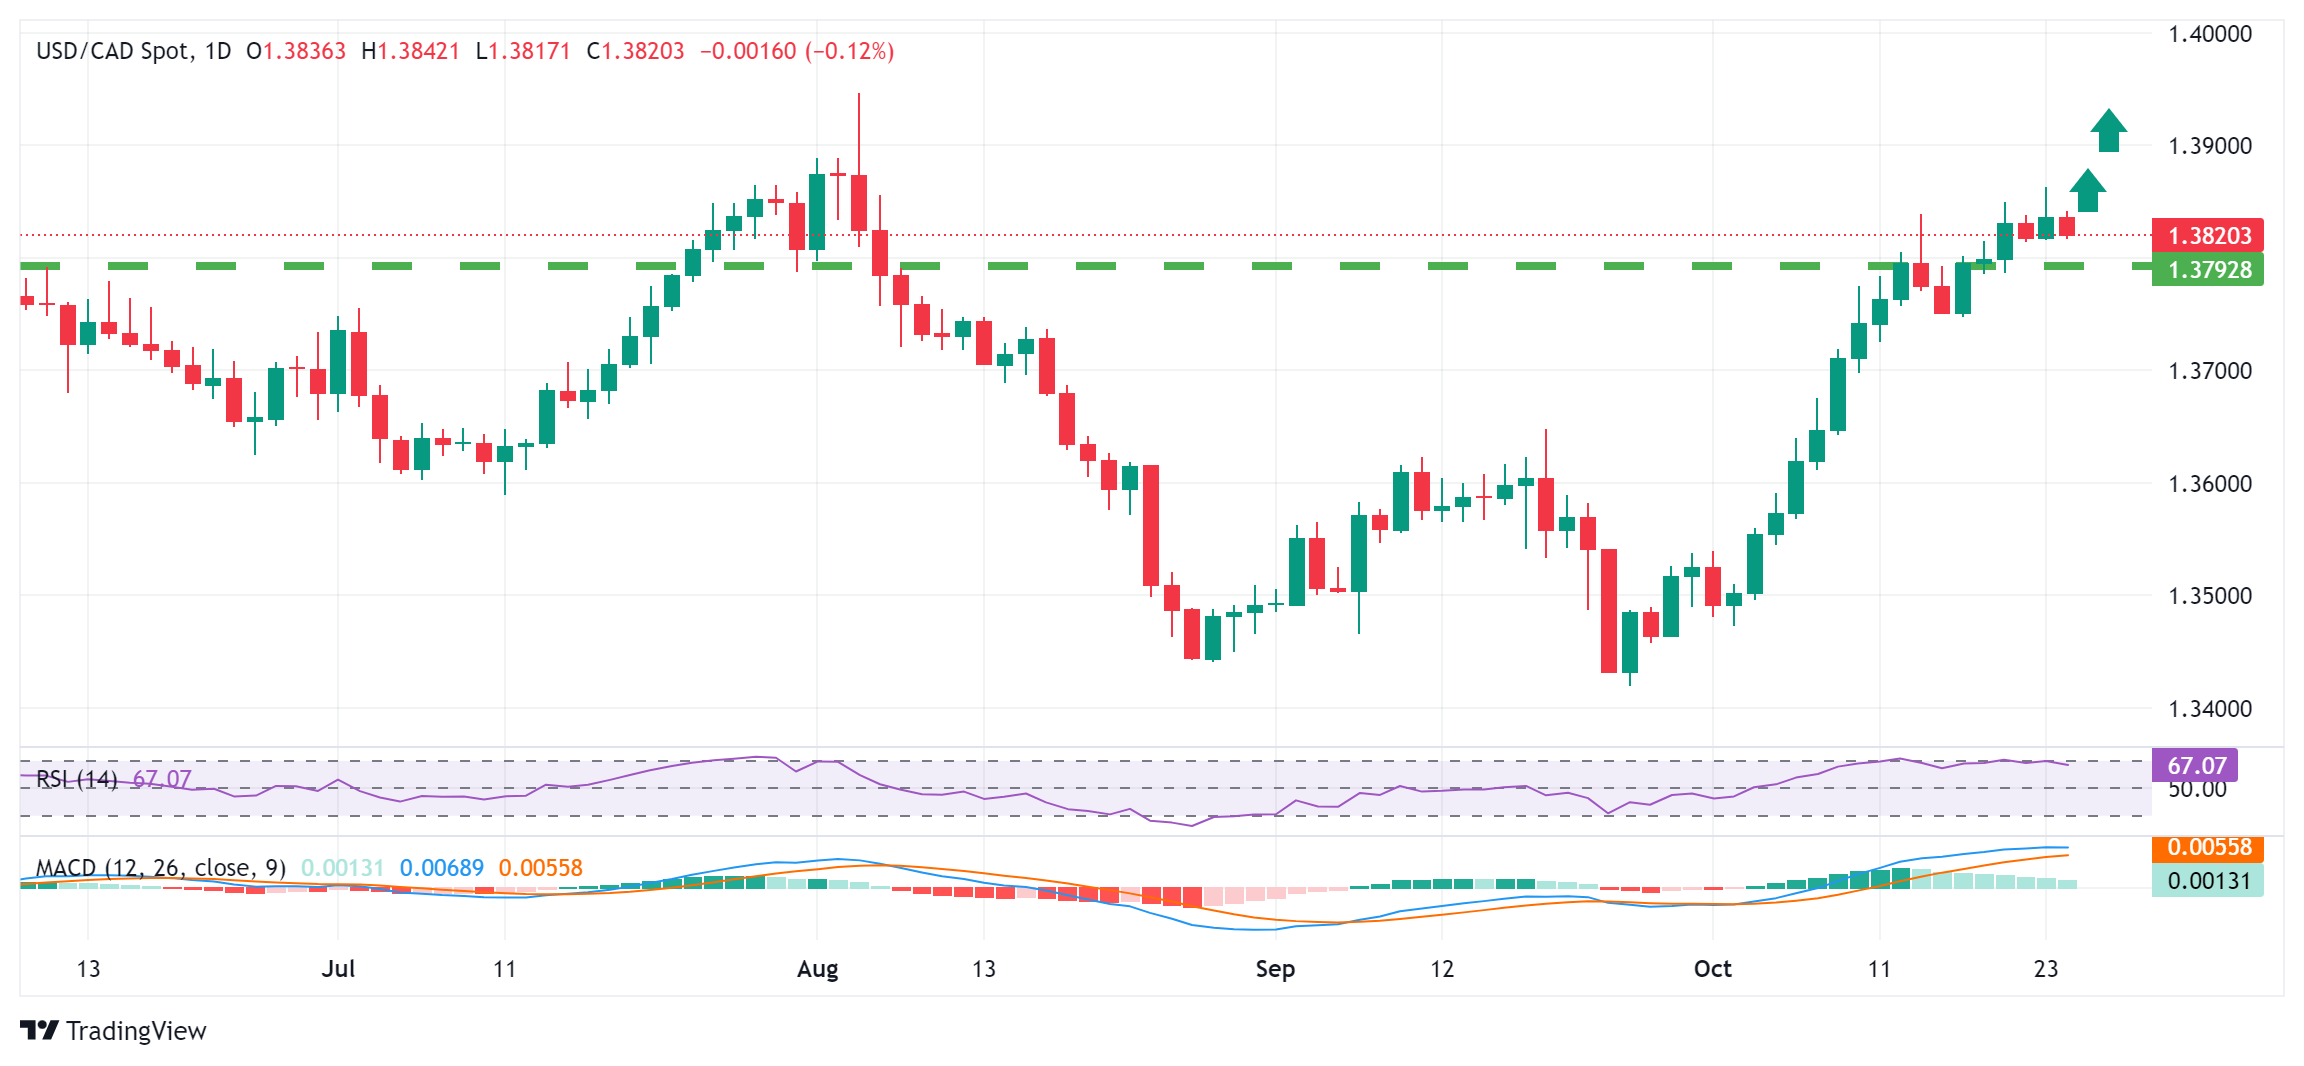
From a technical perspective, a daily close above the 1.3800 mark earlier this week was seen as a fresh trigger for bulls. Adding to this, oscillators on the daily chart are holding comfortably in positive territory and suggest that the path of least resistance for the USD/CAD pair is to the upside. That said, the overnight failure to build on the momentum beyond the 1.3850 region warrants some caution before positioning for further gains. Acceptance above the said area could lift spot prices beyond the 1.3875 intermediate hurdle, towards reclaiming the 1.3900 mark. The upward trajectory could extend further towards challenging the highest level since October 2022, around the 1.3945 region touched last month.
On the flip side, weakness below the 1.3800 mark could be seen as a buying opportunity. This should help limit the downside near last week's swing low, around the 1.3750-1.3745 area. A convincing break below the latter, however, might prompt some technical selling and drag the USD/CAD pair further below the 1.3700 mark, towards testing the 100-day Simple Moving Average (SMA), currently pegged near the 1.3665 region. This is followed by the 200-day SMA, around the 1.3625 zone, which if broken will negate the positive outlook and shift the near-term bias in favor of bearish traders.
USD/CAD daily chart
Premium
You have reached your limit of 3 free articles for this month.
Start your subscription and get access to all our original articles.
Author

Haresh Menghani
FXStreet
Haresh Menghani is a detail-oriented professional with 10+ years of extensive experience in analysing the global financial markets.


