USD/CAD Elliott Wave technical analysis [Video]
![USD/CAD Elliott Wave technical analysis [Video]](https://editorial.fxstreet.com/images/Markets/Currencies/Majors/USDCAD/background-of-canadian-fifty-and-hundred-dollar-bills-2910964_XtraLarge.jpg)
USD/CAD Elliott Wave technical analysis
-
Function: Bullish Trend.
-
Mode: Impulsive.
-
Structure: Orange Wave 5.
-
Position: Navy Blue Wave 1.
-
Direction for next lower degrees: Navy Blue Wave 2.
Details
- Current Status:
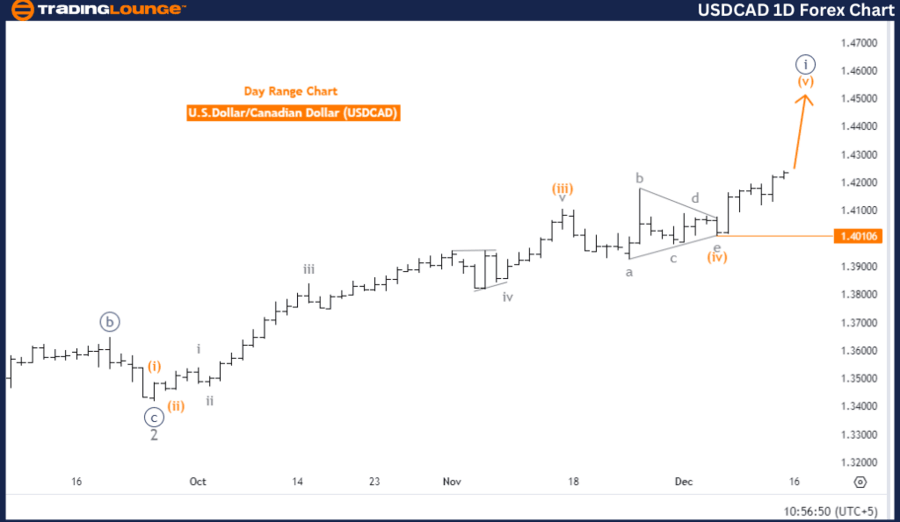
- Orange wave 4 appears completed.
- Orange wave 5 of navy blue wave 1 is in progress.
- Invalidation Level: 1.40106 (A drop below this level invalidates the current Elliott Wave structure).
Analysis overview
The USDCAD daily chart indicates a bullish trend, based on Elliott Wave analysis. The chart's current mode is impulsive, reflecting robust upward momentum within the wave structure.
Key highlights
-
Wave progression:
-
Orange wave 5 is developing within the broader navy blue wave 1 structure.
-
Completion of orange wave 4 has paved the way for sustained upward movement in orange wave 5.
-
-
Final phase:
- Orange wave 5 marks the final phase of navy blue wave 1, typically associated with strong bullish sentiment.
-
Upcoming corrective phase:
- The next phase is expected to be navy blue wave 2, signaling a potential corrective retracement in the larger impulsive sequence.
Key considerations
-
Bullish sentiment:
Orange wave 5 is actively driving prices higher, underlining a bullish bias. -
Potential reassessment:
If prices drop below the invalid level of 1.40106, it will require revisiting the Elliott Wave structure.
Strategic implications for traders
-
Capitalizing on the trend:
Traders and analysts can align their strategies with this phase of the uptrend, leveraging the bullish momentum of orange wave 5. -
Preparing for corrective wave 2:
Awareness of the impending navy blue wave 2 correction can help in managing risk effectively. -
Close observation:
Monitoring price action and wave progression will be essential for successfully navigating this bullish trend.
This analysis underscores a clear bullish trajectory for USDCAD on the daily chart. Traders should remain alert to price levels and wave developments to optimize their strategies during this phase.
USD/CAD Elliott Wave technical analysis
-
Function: Bullish Trend.
-
Mode: Impulsive.
-
Structure: Gray Wave 3.
-
Position: Orange Wave 5.
-
Direction for next lower degrees: Gray Wave 4.
Details
- Current Status:
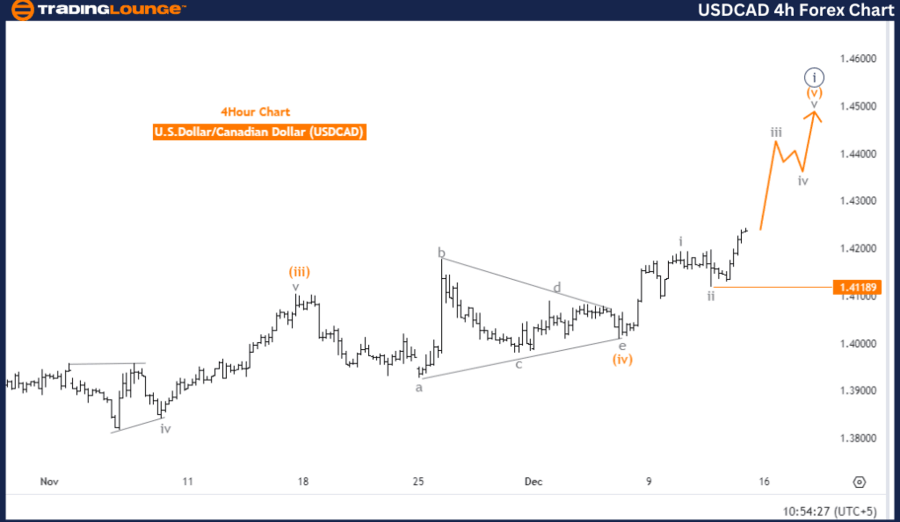
- Gray wave 2 appears completed.
- Gray wave 3 is in progress, with the market positioned in orange wave 5.
- Invalidation Level: 1.41189 (A drop below this level invalidates the current Elliott Wave structure).
Analysis overview
The USDCAD 4-hour chart reveals a bullish trend based on Elliott Wave analysis. The impulsive mode indicates strong upward momentum within gray wave 3, which is the centerpiece of the ongoing uptrend.
Key highlights:
-
Wave progression:
- Gray wave 2 is likely complete, initiating the active phase of gray wave 3.
- The market is currently in orange wave 5, marking the final stage of gray wave 3.
-
Upward momentum:
- Gray wave 3 is often characterized by robust and sustained price increases, reflecting strong bullish sentiment.
-
Upcoming correction:
- After the completion of gray wave 3, the next expected phase is gray wave 4, signaling a potential corrective phase within the larger impulsive wave sequence.
Key considerations
-
Bullish sentiment:
The ongoing gray wave 3 phase aligns with a strong upward trajectory, suggesting further price advances. -
Potential reassessment:
A drop below the invalid level of 1.41189 would negate the current Elliott Wave structure and require reevaluation.
Strategic implications for traders
-
Capitalizing on the trend:
The sustained bullish movement in gray wave 3 provides opportunities for traders to align with the uptrend. -
Preparing for gray wave 4:
Awareness of the potential corrective phase following gray wave 3 will help in managing risk and planning exits. -
Monitoring sub-waves:
Tracking the progression of orange wave 5 and key price levels is crucial for effective market navigation.
This analysis highlights the strength of the USDCAD uptrend on the 4-hour chart, offering actionable insights for traders to adapt their strategies to the prevailing bullish dynamics.
USD/CAD Elliott Wave technical analysis [Video]
Author

Peter Mathers
TradingLounge
Peter Mathers started actively trading in 1982. He began his career at Hoei and Shoin, a Japanese futures trading company.


