USD/CAD Elliott Wave technical analysis [Video]
![USD/CAD Elliott Wave technical analysis [Video]](https://editorial.fxstreet.com/images/Markets/Currencies/Majors/USDCAD/canadian-money-2706551_XtraLarge.jpg)
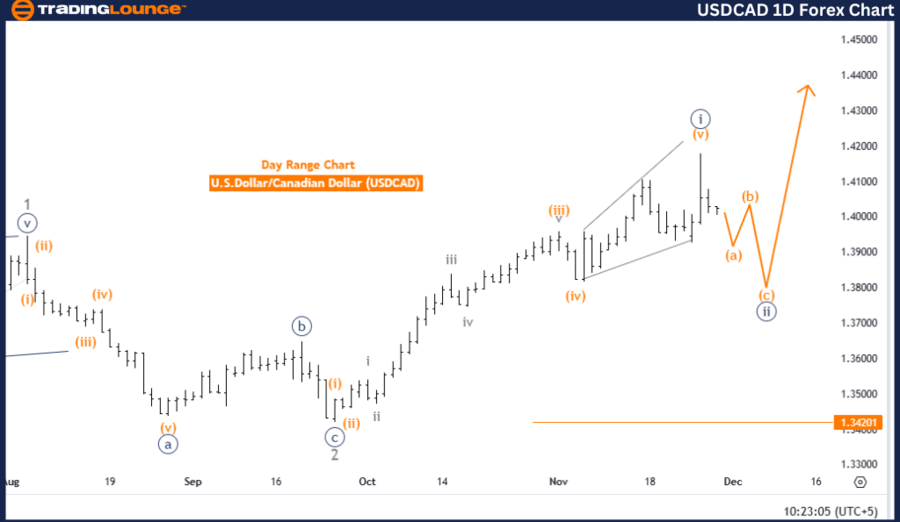
USDCAD Elliott Wave Analysis Trading Lounge Day Chart
U.S. Dollar/Canadian Dollar (USDCAD) Day Chart
USD/CAD Elliott Wave technical analysis
-
Function: Counter Trend.
-
Mode: Corrective.
-
Structure: Navy Blue Wave 2.
-
Position: Gray Wave 3.
-
Direction next higher degrees: Navy Blue Wave 3.
-
Details: Navy blue wave 1 appears complete; navy blue wave 2 is currently unfolding.
-
Wave cancel invalidation level: 1.34201.
The analysis examines the USD/CAD currency pair using Elliott Wave Theory on a daily chart, focusing on a counter-trend phase. The market is identified in a corrective mode, indicating a temporary pullback within the broader trend.
The primary wave structure under observation is navy blue wave 2, which follows the completion of navy blue wave 1. This signals the ongoing corrective phase before transitioning into the next impulsive wave.
The current position resides within gray wave 3, a smaller wave nested inside the navy blue wave 2 corrective structure. This phase highlights the ongoing correction, which is expected to further develop before shifting to navy blue wave 3, marking the continuation of the impulsive upward trend.
Key level for invalidation
An invalidation level is set at 1.34201. If the price reaches this level, the current wave count and corrective outlook will no longer be valid. This level serves as a critical threshold for risk management and confirms the corrective phase's structural integrity.
Summary
-
The Elliott Wave Analysis identifies USDCAD in a counter-trend phase, with navy blue wave 2 actively unfolding.
-
The completion of navy blue wave 1 initiated this corrective phase, while gray wave 3 reflects the ongoing movement within it.
-
The counter-trend outlook remains valid as long as the price remains above the invalidation level of 1.34201.
-
Further corrective action is anticipated before transitioning into the impulsive navy blue wave 3.
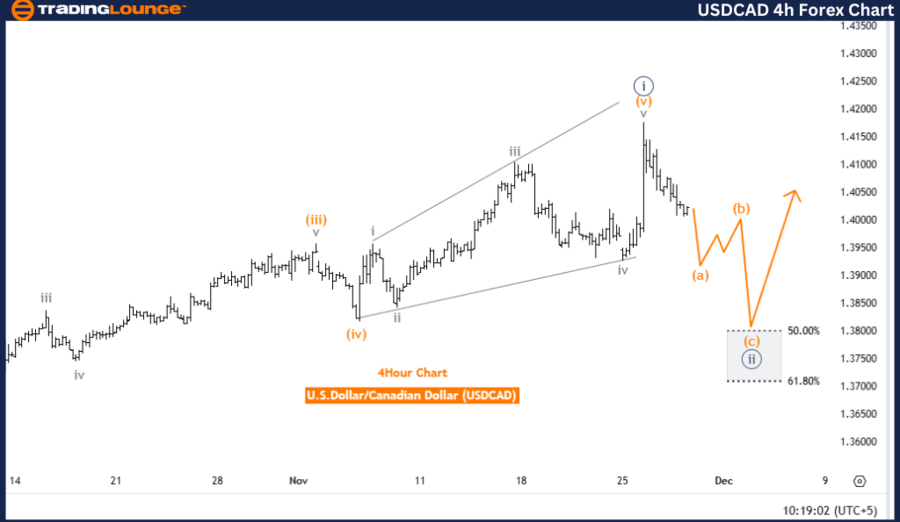
U.S. Dollar/Canadian Dollar (USDCAD) 4-Hour Chart.
USD/CAD Elliott Wave technical analysis
-
Function: Counter Trend.
-
Mode: Impulsive as A.
-
Structure: Orange Wave A.
-
Position: Navy Blue Wave 2.
-
Direction next higher degrees: Orange Wave B.
-
Details: Navy blue wave 1 appears complete; orange wave A of navy blue wave 2 is currently developing.
-
Wave cancel invalidation level: 1.34201.
The analysis evaluates the USD/CAD currency pair using Elliott Wave Theory on a 4-hour chart, identifying a counter-trend phase. The market is currently in an impulsive mode within orange wave A, which represents the initial segment of a broader corrective movement.
This phase follows the completion of navy blue wave 1 and marks the early stages of navy blue wave 2.
The current position resides within orange wave A of navy blue wave 2, reflecting the first corrective leg. This movement is expected to continue within the current structure before transitioning to orange wave B, which represents the next stage of the correction at a higher degree.
Key level for invalidation
An invalidation level is defined at 1.34201. If the price reaches this threshold, the current wave count and corrective outlook will no longer hold. This level is a critical reference point for risk management and confirms the structural integrity of the corrective phase.
Summary
-
The Elliott Wave Analysis identifies USDCAD in a counter-trend phase, with orange wave A actively unfolding as part of navy blue wave 2.
-
The completion of navy blue wave 1 marked the beginning of this corrective structure.
-
The counter-trend outlook remains valid as long as the price stays above the invalidation level of 1.34201.
-
Further movement is anticipated in orange wave A, followed by the progression of orange wave B, completing the corrective phase at the next higher degree.
USD/CAD Elliott Wave technical analysis [Video]
Author

Peter Mathers
TradingLounge
Peter Mathers started actively trading in 1982. He began his career at Hoei and Shoin, a Japanese futures trading company.


