USD/CAD Elliott Wave technical analysis [Video]
![USD/CAD Elliott Wave technical analysis [Video]](https://editorial.fxstreet.com/images/Markets/Currencies/Majors/USDCAD/canadian-money-2682954_XtraLarge.jpg)
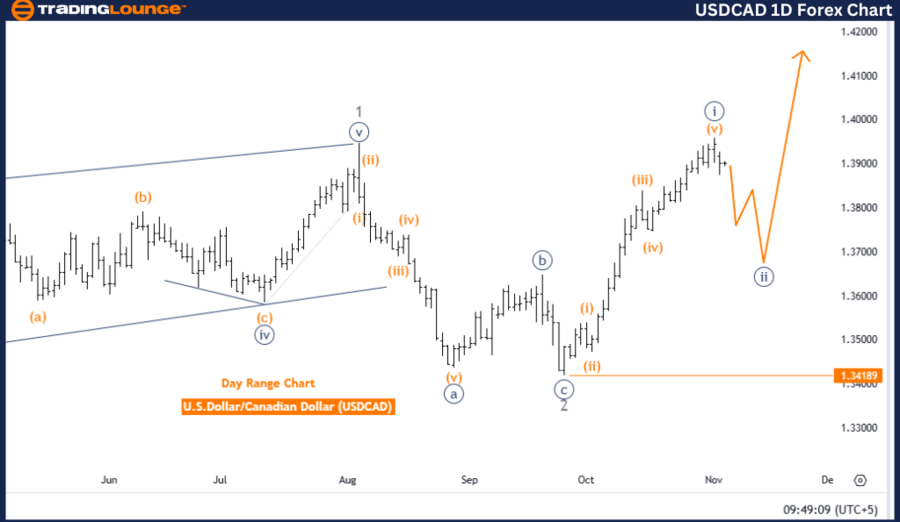
U.S. Dollar / Canadian Dollar (USDCAD) – Day Chart Analysis
USD/CAD Elliott Wave technical analysis
-
Function: Counter Trend.
-
Mode: Corrective.
-
Structure: Navy blue wave 2.
-
Position: Gray wave 1.
-
Next higher degree direction: Navy blue wave 3.
-
Details: Navy blue wave 1 appears to have completed, and now navy blue wave 2 is currently active.
-
Wave cancel invalid level: 1.34189.
Analysis summary
The daily Elliott Wave analysis for the USD/CAD currency pair suggests a counter-trend corrective structure centered on navy blue wave 2. This setup indicates a possible short-term consolidation phase. After the completion of navy blue wave 1, the market has transitioned into this corrective navy blue wave 2, signaling a retracement within the larger trend. This stage often includes pullbacks or consolidation periods, allowing the price to stabilize before potentially continuing in the primary trend direction.
Current position
Currently, USDCAD resides within gray wave 1, marking the initial phase of navy blue wave 2. The analysis points to the corrective phase potentially leading to temporary sideways or downward movement. Upon completing navy blue wave 2, the price is expected to shift upward into navy blue wave 3, aligning with the broader bullish trend.
Key level – Wave cancel invalid level
The invalidation level for this wave pattern is set at 1.34189. Should the price drop below this level, it would invalidate the current wave structure, hinting at a potential trend shift or an extended corrective phase. Maintaining a price above this level, however, supports the current Elliott Wave configuration and suggests that navy blue wave 2 will likely complete, setting the stage for an upward move into navy blue wave 3.
This analysis highlights USDCAD in a counter-trend phase, with navy blue wave 2 active. If the price holds above the 1.34189 level, the corrective structure is anticipated to end, likely paving the way for a continuation of the primary bullish trend into navy blue wave 3.
USD/CAD Elliott Wave technical analysis
-
Function: Counter Trend.
-
Mode: Corrective.
-
Structure: Navy blue wave 2.
-
Position: Gray wave 1.
-
Next higher degree direction: Navy blue wave 3.
-
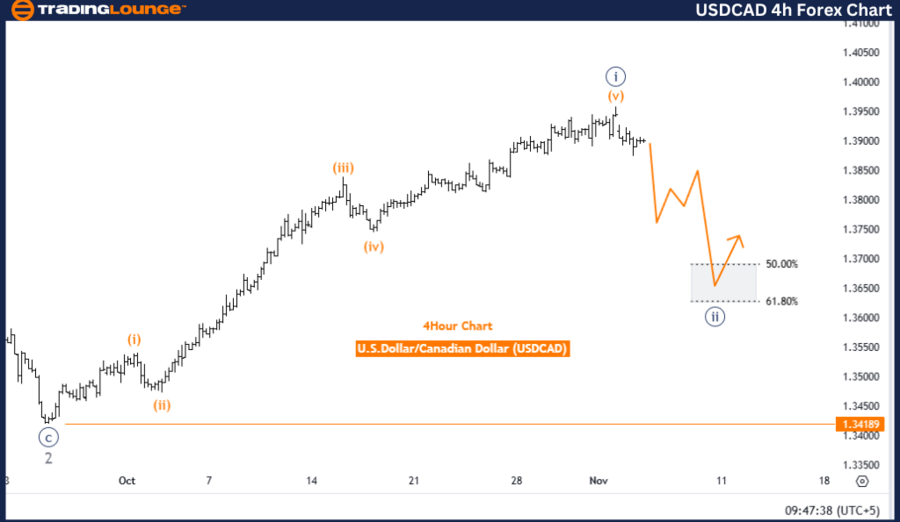
Details: Navy blue wave 1 appears complete, with navy blue wave 2 currently in progress.
-
Wave cancel invalid level: 1.34189.
Analysis summary
The 4-hour Elliott Wave analysis for USDCAD identifies a counter-trend corrective structure focused on navy blue wave 2. This movement comes after the completion of navy blue wave 1, signaling that the market has entered a retracement phase. Currently positioned within gray wave 1, the chart shows temporary consolidation consistent with a counter-trend move.
Current structure
During this corrective phase, navy blue wave 2 is likely progressing, which allows for short-term price adjustments before potentially resuming the main upward trend toward navy blue wave 3. According to Elliott Wave theory, corrective waves such as navy blue wave 2 typically represent a pause or retracement, helping to reset momentum for the upcoming trend phase. This wave’s corrective nature may suggest a brief consolidation, leading to a potential opportunity for an upward move in alignment with the primary bullish trend.
Key level – Wave cancel invalid level
The invalidation level for the wave pattern is marked at 1.34189. Should the price drop below this level, it would invalidate the current wave structure, implying a potential shift in the anticipated wave pattern. However, maintaining price action above this level supports the integrity of the corrective pattern and suggests that navy blue wave 2 will conclude, paving the way for continuation into navy blue wave 3. This invalidation threshold is crucial for confirming the forecasted wave structure, offering a key reference for analyzing potential price movements within this timeframe.
In summary, the analysis indicates that navy blue wave 2 currently represents a retracement phase within a larger upward trend for USDCAD. If the price remains above the invalidation level of 1.34189, the expectation is that this corrective phase will conclude, leading to renewed upward momentum in line with the overall trend toward navy blue wave 3.
USD/CAD Elliott Wave technical analysis [Video]
Author

Peter Mathers
TradingLounge
Peter Mathers started actively trading in 1982. He began his career at Hoei and Shoin, a Japanese futures trading company.


