USD/CAD Elliott Wave technical analysis [Video]
![USD/CAD Elliott Wave technical analysis [Video]](https://editorial.fxstreet.com/images/Markets/Currencies/Majors/USDCAD/dollars-9871878_XtraLarge.jpg)
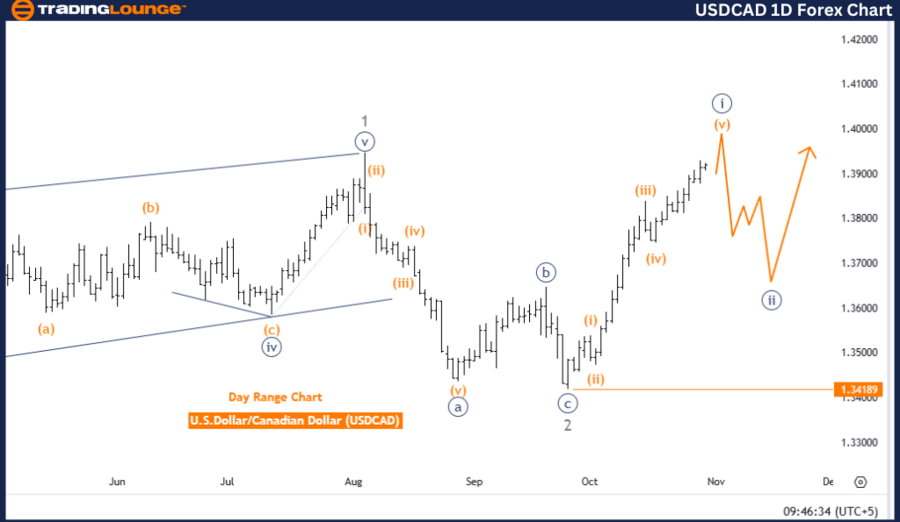
USD/CAD Elliott Wave technical analysis
-
Function: Bullish Trend.
-
Mode: Impulsive.
-
Structure: Navy Blue Wave 1.
-
Position: Gray Wave 3.
-
Direction for next lower degrees: Navy Blue Wave 2.
-
Details: Navy Blue Wave 1 remains active and appears close to completion.
-
Wave cancellation level: 1.34189.
The daily Elliott Wave analysis for USDCAD highlights a bullish trend in an impulsive mode, specifically within the navy blue wave 1, situated in gray wave 3. This analysis indicates that USDCAD is in an early upward phase, following a standard impulsive pattern reflecting strong bullish momentum.
Currently, navy blue wave 1 remains active, signaling further upward movement as it approaches completion. Given its position within gray wave 3, this wave structure supports the outlook for additional gains in USDCAD, driven by the dominant impulsive characteristics of navy blue wave 1. Typically, this phase represents a rise in price, backed by buyers sustaining the upward trend.
Upon the completion of navy blue wave 1, the structure is expected to transition to navy blue wave 2, initiating a potential corrective phase. This adjustment phase may moderate some of the bullish momentum built up in navy blue wave 1, allowing for consolidation before any continuation of the trend.
The wave cancellation level is set at 1.34189, serving as a critical validation point. Should USDCAD fall below this level, the current Elliott Wave count would be invalidated, necessitating a reassessment of the wave structure. However, staying above this level would support the ongoing bullish outlook.
Summary: The daily analysis of USDCAD points to a sustained bullish Elliott Wave structure, with the impulsive mode of navy blue wave 1 approaching completion. The anticipated formation of navy blue wave 2 suggests a forthcoming corrective phase after the recent bullish move. The 1.34189 level acts as a key threshold, maintaining the bullish wave count’s integrity as long as prices stay above this point.
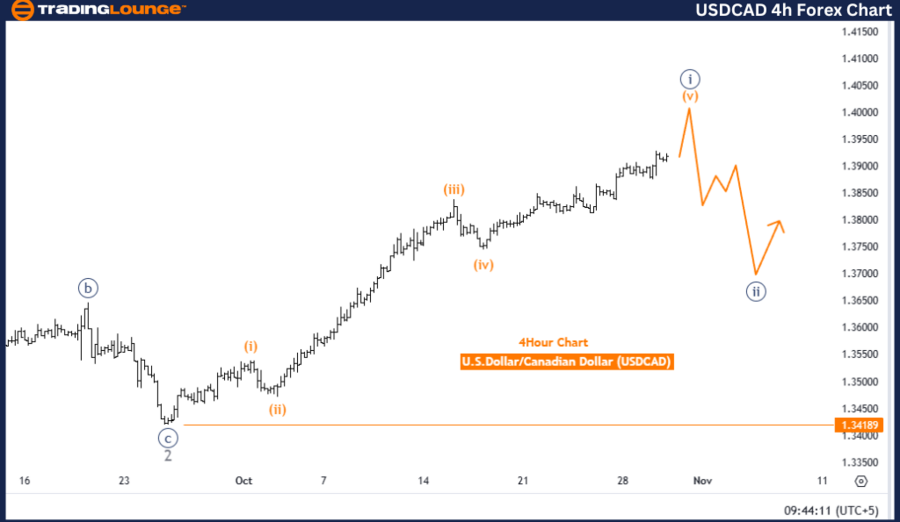
USD/CAD Elliott Wave technical analysis
-
Function: Bullish Trend.
-
Mode: Impulsive.
-
Structure: Orange Wave 5.
-
Position: Navy Blue Wave 1.
-
Direction for next lower degrees: Navy Blue Wave 2.
-
Details: Orange wave 4 appears complete, and now orange wave 5 of 1 is active.
-
Wave cancellation level: 1.34189.
The four-hour Elliott Wave analysis for USDCAD highlights a bullish trend in an impulsive mode, currently focusing on orange wave 5 within the broader framework of navy blue wave 1. This setup indicates that the market is nearing the end stages of the initial navy blue wave 1 sequence, with orange wave 5 now active and moving upward.
Orange wave 4 seems to have concluded its corrective phase, paving the way for the progression of orange wave 5 within navy blue wave 1. This impulsive upward move suggests ongoing momentum in USDCAD, aligning with the broader bullish trend identified within this timeframe. The position within navy blue wave 1 supports this push upward, representing the start of a bullish Elliott Wave cycle, typically marked by strong buying activity and decisive price action.
The next anticipated shift at a lower degree would move toward navy blue wave 2, likely introducing a corrective phase following the completion of navy blue wave 1. This transition may allow the market to consolidate or retrace after the impulsive rise of navy blue wave 1, a phase generally characterized by pullbacks as part of the larger bullish cycle.
The wave cancellation level is identified at 1.34189. If prices were to fall below this point, the current Elliott Wave count would be invalidated, requiring a reassessment of the wave structure. However, maintaining levels above this threshold supports the continuation of the current bullish wave outlook.
Summary: The USDCAD four-hour analysis shows a bullish Elliott Wave structure with an active impulsive movement in orange wave 5 within navy blue wave 1. This trend is likely to persist, with further upward momentum anticipated until the formation of navy blue wave 2 initiates. The critical level of 1.34189 serves as a validation threshold, maintaining the bullish perspective as long as prices remain above this point.
USD/CAD Elliott Wave technical analysis [Video]
Author

Peter Mathers
TradingLounge
Peter Mathers started actively trading in 1982. He began his career at Hoei and Shoin, a Japanese futures trading company.


