USD/CAD Elliott Wave technical analysis [Video]
![USD/CAD Elliott Wave technical analysis [Video]](https://editorial.fxstreet.com/images/Markets/Currencies/Majors/USDCAD/canadian-money-2670959_XtraLarge.jpg)
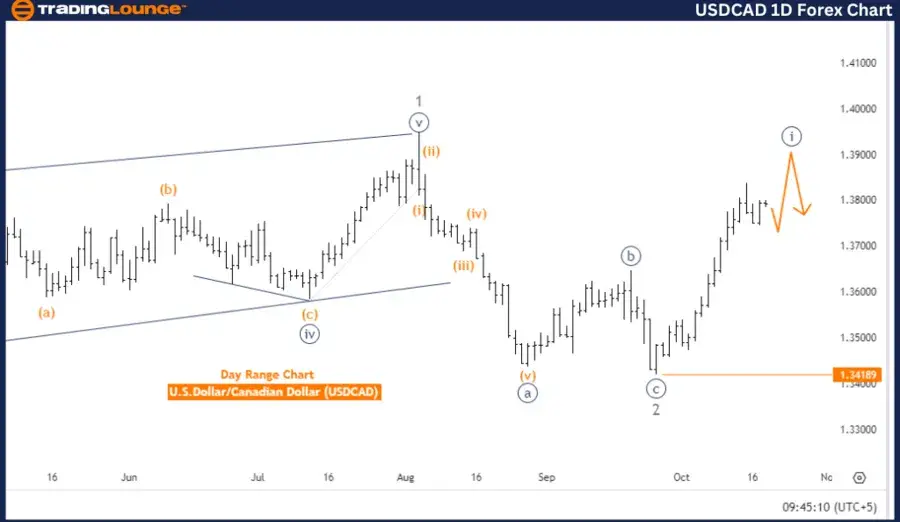
USDCAD Elliott Wave Analysis - Trading Lounge
U.S. Dollar/Canadian Dollar (USDCAD) Day Chart
USD/CAD Elliott Wave technical analysis
Function: Trend.
Mode: Impulsive.
Structure: Navy Blue Wave 1.
Position: Gray wave 3.
Direction next lower degrees: Navy blue wave 2.
Details: Navy blue wave 1 of gray wave 3 is still in play. Wave cancellation/invalid level: 1.34189.
The USDCAD Elliott Wave analysis on the day chart indicates an impulsive trend, signifying a strong upward movement in the market. The primary structure of focus is navy blue wave 1, which is part of the larger gray wave 3.
Currently, the market is situated within gray wave 3, and navy blue wave 1 remains in progress. This wave implies that the upward trend is continuing, with the market likely to complete this phase before advancing to the next stage of the wave sequence. The ongoing movement in navy blue wave 1 reflects sustained bullish momentum, forming part of the impulsive wave structure.
The next anticipated phase is navy blue wave 2, representing a potential corrective phase after the completion of the current impulsive wave. This phase may lead to a temporary pullback or consolidation before the upward trend resumes in the subsequent wave. However, the analysis suggests that for now, navy blue wave 1 is still active, signaling further upward movement in the short term.
A wave cancellation or invalidation level is identified at 1.34189. If the price drops below this level, the current Elliott Wave count would be invalidated, and the market's wave structure would need to be reassessed. As long as the price remains above this level, the bullish trend within navy blue wave 1 of gray wave 3 is expected to persist.
Summary:
-
USDCAD is in an impulsive phase, with navy blue wave 1 of gray wave 3 still in progress.
-
The market is in an upward trend, with an invalidation level at 1.34189.
-
The next phase will likely involve a corrective movement in navy blue wave 2.
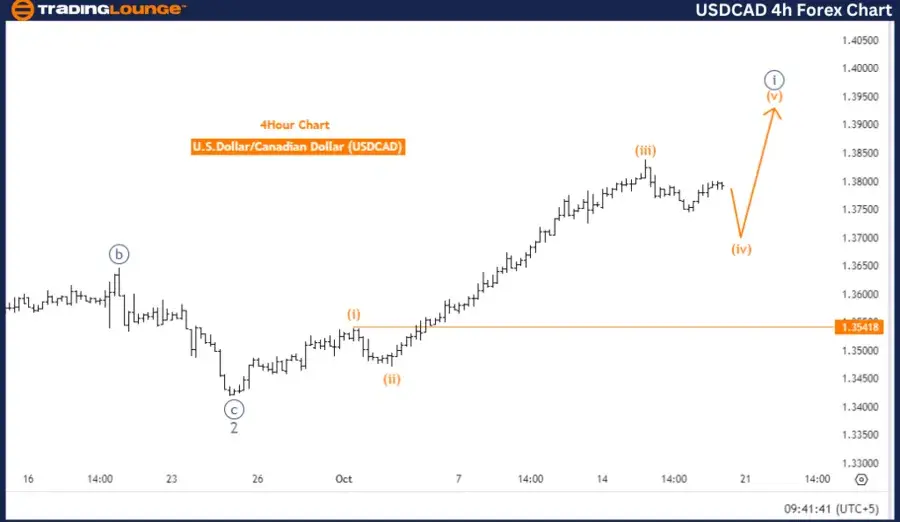
U.S. Dollar / Canadian Dollar (USDCAD) 4 Hour Chart
USD/CAD Elliott Wave technical analysis
Function: Counter Trend.
Mode: Corrective.
Structure: Orange wave 4.
Position: Navy Blue Wave 1.
Direction next higher degrees: Orange wave 5.
Details: Orange Wave 3 is complete, and Orange Wave 4 is now in play. Wave cancellation/invalidation level: 1.35418.
The USDCAD Elliott Wave analysis on the 4-hour chart presents a counter-trend scenario, focusing on a corrective pattern. The primary wave structure under analysis is orange wave 4, marking a corrective phase after the completion of the previous impulsive movement in orange wave 3.
The analysis indicates that orange wave 3 has concluded, and the market is now progressing through orange wave 4. This wave represents a corrective movement within the broader wave sequence, typically characterized by consolidation or a pullback. Orange wave 4 is expected to act as a temporary retracement before the market resumes its upward movement in orange wave 5.
At this stage, the market is positioned within navy blue wave 1, which is part of orange wave 4. This signals the initiation of the corrective phase, with the market currently moving through this retracement period as it prepares for the eventual continuation of the larger upward trend in orange wave 5.
The analysis identifies a wave cancellation or invalidation level at 1.35418. Should the price fall below this level, the current wave count and analysis would be invalidated, requiring a reassessment of the market's wave structure. However, as long as the price remains above this level, the corrective phase of orange wave 4 is expected to continue, with potential for upward movement in orange wave 5 once the correction concludes.
Summary:
-
USDCAD is in a corrective phase, with orange wave 4 in progress following the completion of orange wave 3.
-
The market is currently consolidating or retracing during this phase.
-
The invalidation level is set at 1.35418, with an upward movement likely after orange wave 4 completes, leading into orange wave 5.
Technical analyst: Malik Awais.
USD/CAD Elliott Wave technical analysis [Video]
Author

Peter Mathers
TradingLounge
Peter Mathers started actively trading in 1982. He began his career at Hoei and Shoin, a Japanese futures trading company.


