USD/CAD Elliott Wave technical analysis [Video]
![USD/CAD Elliott Wave technical analysis [Video]](https://editorial.fxstreet.com/images/Markets/Currencies/Majors/USDCAD/dollars-11347249_XtraLarge.jpg)
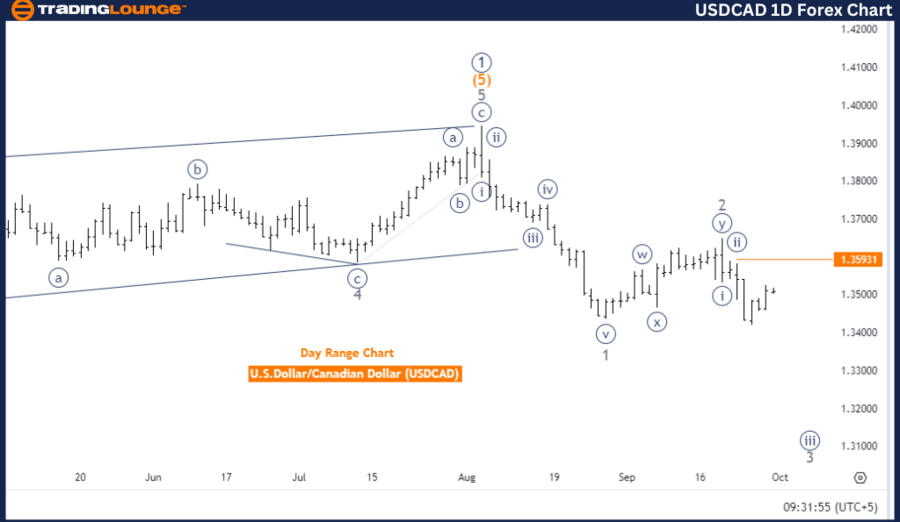
USD/CAD Elliott Wave technical analysis
Function: Bearish Trend.
Mode: Impulsive.
Structure: Navy Blue Wave 3.
Position: Gray Wave 3.
Direction (next lower degrees): Navy Blue Wave 3 (Started).
Details: Navy Blue Wave 2 appears completed, and Navy Blue Wave 3 is now in play.
Wave cancel invalid level: 1.35931.
The USDCAD Elliott Wave Analysis for the daily chart reflects a bearish trend, pointing to a downward movement for the U.S. Dollar against the Canadian Dollar. Classified as impulsive, this trend highlights a strong directional force pushing the market lower. The current structure under analysis is Navy Blue Wave 3, an integral phase of the ongoing bearish movement.
At present, the market is positioned in Gray Wave 3, which forms part of a broader bearish trend within Navy Blue Wave 3. This suggests that the bearish momentum is gaining traction, as the market advances further into the wave sequence. Navy Blue Wave 3, which has just commenced, is anticipated to extend the downward trend following the completion of the corrective Navy Blue Wave 2.
Navy Blue Wave 2 is deemed complete, allowing for the full progression of Navy Blue Wave 3. In the Elliott Wave theory, Wave 3 in an impulsive sequence typically marks the strongest and longest phase, implying that the current bearish trend could accelerate as Wave 3 continues its development.
A critical level to observe is 1.35931, which serves as the Wave Cancel Invalidation Point. Should the market rise above this level, the present Elliott Wave analysis would be invalid, necessitating a reassessment of the bearish outlook. This invalidation point is crucial for traders, as remaining below it confirms the continuation of the bearish trend.
Summary
The USDCAD Elliott Wave analysis suggests a strong bearish trend, driven by Navy Blue Wave 3, indicating further declines for the U.S. Dollar against the Canadian Dollar. Traders should monitor the 1.35931 invalidation level, as any movement above this threshold would invalidate the current analysis. The bearish trend holds as long as the price remains below this level.
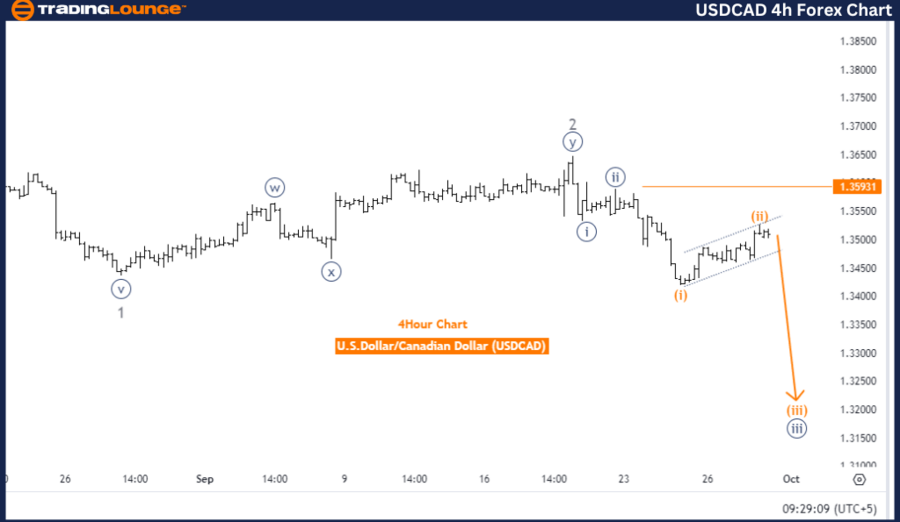
U.S. Dollar / Canadian Dollar (USDCAD) 4 Hour Chart.
USD/CAD Elliott Wave technical analysis
Function: Bearish Trend.
Mode: Impulsive.
Structure: Orange Wave 3.
Position: Navy Blue Wave 3.
Direction (next lower degrees): Orange Wave 3 (Started).
Details: Orange Wave 2 appears completed, and Orange Wave 3 is now in play.
Wave cancel invalid level: 1.35931.
The USDCAD Elliott Wave Analysis for the 4-hour chart reveals a bearish trend, indicating a potential decline for the U.S. Dollar against the Canadian Dollar. The mode is impulsive, showing a strong directional movement in line with the prevailing trend. The structure under analysis is Orange Wave 3, which plays a critical role in the ongoing bearish movement.
Regarding positioning, the market is within Navy Blue Wave 3, which is part of a broader bearish trend. The focus is on Orange Wave 3, which has recently begun following the completion of Orange Wave 2. The corrective Orange Wave 2 is now considered complete, allowing for the continuation of the downward movement in Orange Wave 3.
The next expected development is the full extension of Orange Wave 3. Within the Elliott Wave framework, Wave 3 in an impulsive sequence typically represents the strongest and most pronounced wave, suggesting that the bearish trend could intensify. This implies there may be more downside potential for the U.S. Dollar relative to the Canadian Dollar in the short term.
A key level to observe is 1.35931, which serves as the Wave Cancel Invalidation Level. If the price surpasses this level, the current Elliott Wave analysis would be invalid, prompting a reassessment of the trend. This level is crucial for traders as it indicates whether the bearish trend remains intact.
Summary
The USDCAD Elliott Wave analysis signals a continued bearish trend, with Orange Wave 3 driving further declines. Traders should keep a close watch on the 1.35931 invalidation level, as any movement above this point could indicate a shift in the market’s direction. Until then, the bearish trend is likely to persist.
USD/CAD Elliott Wave technical analysis [Video]
Author

Peter Mathers
TradingLounge
Peter Mathers started actively trading in 1982. He began his career at Hoei and Shoin, a Japanese futures trading company.


