USD/CAD Elliott Wave technical analysis [Video]
![USD/CAD Elliott Wave technical analysis [Video]](https://editorial.fxstreet.com/images/Markets/Currencies/Majors/USDCAD/dollars-11347249_XtraLarge.jpg)
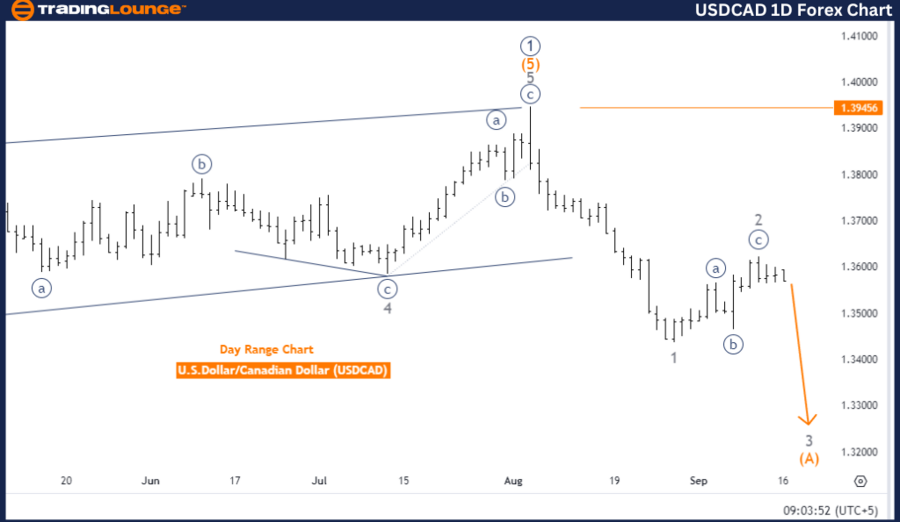
USDCAD Elliott Wave Analysis Trading Lounge Day Chart, U.S. Dollar / Canadian Dollar (USDCAD) Day Chart.
USD/CAD Elliott Wave technical analysis
-
Function: Trend.
-
Mode: Impulsive.
-
Structure: Gray Wave 3.
-
Direction next lower degrees: Gray Wave 3 (started).
-
Details: Gray wave 2 appears completed, with gray wave 3 now in progress.
-
Wave cancel invalid level: 1.39456.
The daily chart analysis of USDCAD using Elliott Wave Theory shows that the market is currently in an impulsive trend mode, indicating strong price action. The wave structure currently being tracked is gray wave 3, part of an impulsive wave sequence often observed during market trends. Gray wave 2 is considered to have completed, and gray wave 3 has now initiated.
Gray wave 3 typically represents the most extended and dynamic phase of the Elliott Wave cycle, signaling a strong continuation in the market's prevailing trend. This wave usually follows a corrective phase, indicating that the market is poised for a more forceful move either upward or downward, depending on the overall trend. In this scenario, gray wave 3 has already begun, suggesting that USDCAD is likely to experience a strong price movement aligned with the trend.
Both the higher and lower degrees are also moving within gray wave 3, showing that multiple time frames are in alignment. This convergence strengthens the confidence in the ongoing trend, increasing the likelihood that it will persist.
An invalidation level has been set at 1.39456, meaning if the price falls below this point, the current wave structure would be considered invalid. In such a case, traders may need to reassess the wave count and adjust their trading strategy accordingly.
In summary, USDCAD is in gray wave 3 of an impulsive trend on the daily chart. The trend is expected to continue robustly, with the invalidation level marked at 1.39456. A break below this level would necessitate a reevaluation of the wave count.
USD/CAD four-hour chart
-
Function: Trend.
-
Mode: Impulsive.
-
Structure: Gray Wave 3.
-
Direction next lower degrees: Gray Wave 3 (started).
-
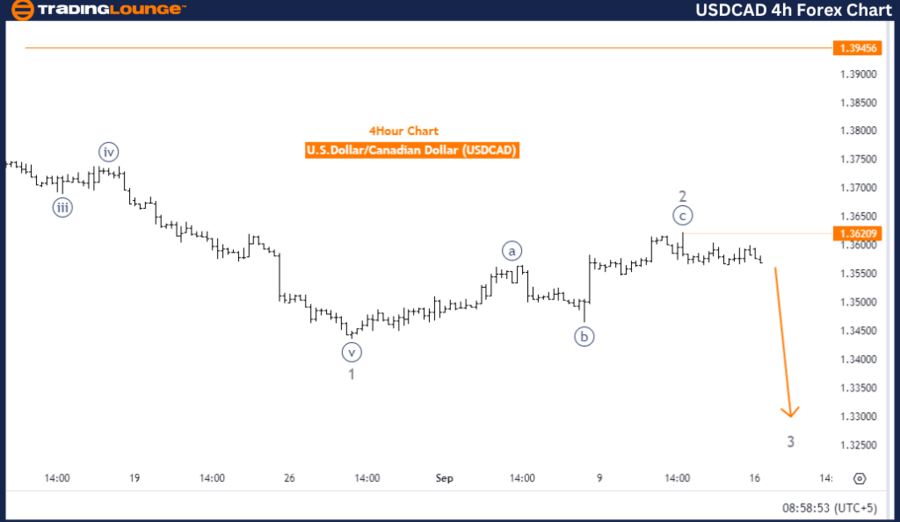
Details: Gray wave 2 appears completed, and gray wave 3 is now in progress.
-
Wave cancel invalid level: 1.39456.
The Elliott Wave analysis of the USDCAD 4-hour chart suggests that the market is currently in an impulsive mode, indicating a strong continuation of the trend. The wave structure being tracked is gray wave 3, which marks the beginning of an aggressive move, either upwards or downwards. With gray wave 2 now completed, the market has exited the corrective phase and is advancing into gray wave 3.
Gray wave 3 is recognized for its sharp, rapid movements and often represents the most powerful part of the Elliott Wave cycle. As the wave in play, it indicates that USDCAD is in a strong trend, whether to the upside or downside, depending on the overall market direction.
The analysis confirms that gray wave 3 has already begun, signaling the impulsive nature of the current market condition. Traders should anticipate further price acceleration in the direction of the trend during this phase. The lower degree wave is also in gray wave 3, reinforcing the strength of the ongoing trend.
The invalidation level for this wave is set at 1.39456. If the price falls below this level, the current wave structure would be invalid, which may indicate a potential trend reversal or a need to reassess the wave count.
In summary, USDCAD is in the impulsive phase of gray wave 3, following the completion of gray wave 2. The market is expected to maintain its strong trend, with the invalidation level set at 1.39456, beyond which the current Elliott Wave analysis may no longer hold.
USD/CAD Elliott Wave technical analysis [Video]
Author

Peter Mathers
TradingLounge
Peter Mathers started actively trading in 1982. He began his career at Hoei and Shoin, a Japanese futures trading company.


