USD/CAD Elliott Wave technical analysis [Video]
![USD/CAD Elliott Wave technical analysis [Video]](https://editorial.fxstreet.com/images/Markets/Currencies/Majors/USDCAD/hundred-dollar-bills-canadian-3057589_XtraLarge.jpg)
USD/CAD Elliott Wave technical analysis
-
Function: Counter Trend.
-
Mode: Impulsive.
-
Structure: Gray wave 5.
-
Position: Orange wave A.
-
Direction next higher degrees: Orange wave B.
-
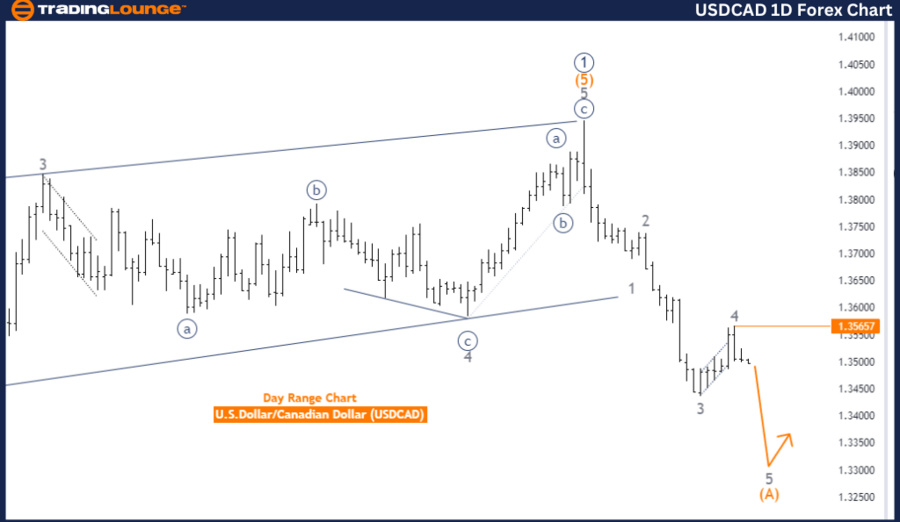
Details: Gray wave 4 is now completed, and gray wave 5 is in progress.
-
Wave cancel invalidation level: 1.35657.
The USD/CAD daily chart is currently showing a counter-trend movement, identified through Elliott Wave technical analysis. This counter-trend is unfolding in an impulsive mode, signaling a strong market direction. The structure under review is gray wave 5, which follows the completion of gray wave 4. With gray wave 4 now completed, gray wave 5 has started and is currently active.
At present, the market is positioned within orange wave A, which is part of the larger wave structure. Once orange wave A concludes, the next anticipated wave is orange wave B, which belongs to a higher degree of the wave sequence. This suggests that after the current impulsive phase of gray wave 5, the market could transition into a corrective phase, represented by orange wave B.
Additionally, the analysis provides a wave cancellation invalidation level of 1.35657. If the price reaches or exceeds this level, the current wave analysis would become invalid, necessitating a reevaluation of the market structure. It is advised that traders closely monitor this level to ensure the current wave pattern remains intact.
In summary
-
Gray wave 5 is now in play after the completion of gray wave 4.
-
The market is situated within orange wave A, with orange wave B expected to follow.
-
The wave cancel invalidation level is set at 1.35657, which serves as a key level for confirming the continuation of the current wave pattern or signaling the need for reassessment if breached.
USD/CAD Elliott Wave technical analysis
-
Function: Counter Trend.
-
Mode: Impulsive.
-
Structure: Gray wave 5.
-
Position: Orange wave A.
-
Direction next higher degrees: Orange wave B.
-
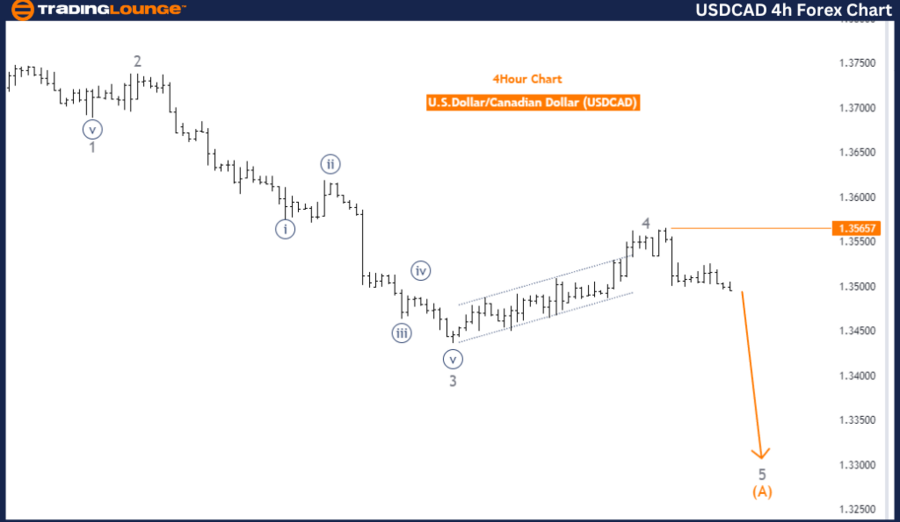
Details: Gray wave 4 has completed, and gray wave 5 is currently in progress.
-
Wave cancel invalidation level: 1.35657.
The USD/CAD 4-hour chart is currently showing a counter-trend movement, identified through Elliott Wave technical analysis. This movement is classified as impulsive, indicating rapid market progression in a specific direction.
The wave structure under analysis is gray wave 5, which follows the completion of gray wave 4. With gray wave 4 completed, the market has now entered gray wave 5, continuing the current trend. The market is currently positioned within orange wave A, part of the broader wave cycle, and orange wave B is expected to follow.
The next higher degree movement will be orange wave B, emerging after orange wave A completes. This suggests that after the current impulsive phase, a corrective phase (orange wave B) may develop.
The analysis highlights a critical wave cancellation invalidation level at 1.35657. If the market reaches or surpasses this level, the current wave structure and analysis will be invalidated, requiring a reassessment of the trend and wave pattern.
In conclusion
-
Gray wave 5 is currently in progress after the completion of gray wave 4.
-
The market is positioned in orange wave A, with orange wave B expected next.
-
Traders should monitor the invalidation level of 1.35657 to validate the current wave structure or adjust their analysis if this level is breached.
USD/CAD Elliott Wave technical analysis [Video]
Author

Peter Mathers
TradingLounge
Peter Mathers started actively trading in 1982. He began his career at Hoei and Shoin, a Japanese futures trading company.


