USD/CAD Elliott Wave technical analysis [Video]
![USD/CAD Elliott Wave technical analysis [Video]](https://editorial.fxstreet.com/images/Markets/Currencies/Majors/USDCAD/canadian-currency-4020670_XtraLarge.jpg)
USD/CAD Elliott Wave technical analysis
-
Function: Counter Trend.
-
Mode: Impulsive as A.
-
Structure: Gray Wave 3.
-
Position: Orange Wave A.
-
Next higher degrees direction: Gray Wave 4.
-
Details: Gray Wave 2 appears completed, Gray Wave 3 is now active.
-
Wave cancel invalidation level: 1.35738.
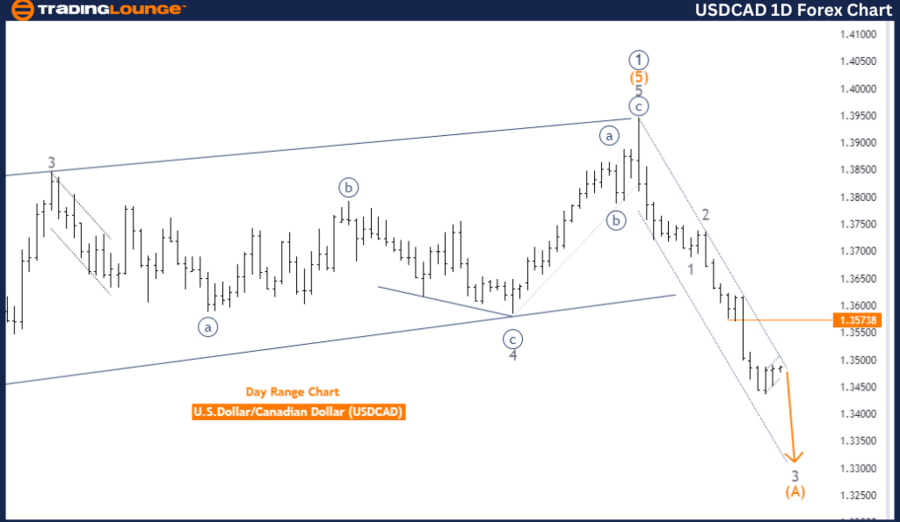
The USD/CAD currency pair is currently undergoing a counter-trend phase, as indicated by the Elliott Wave analysis on the daily chart. The market is in an impulsive mode within Wave A, signaling a temporary reversal against the broader trend. The primary structure in focus is Gray Wave 3, which has commenced following the completion of Gray Wave 2.
The analysis suggests that Gray Wave 2 has likely completed, with the market now progressing into Gray Wave 3. This wave is part of an impulsive move, typically occurring in the direction of the prevailing trend after a corrective phase. The market's current position is within Orange Wave A, which is integral to the ongoing impulsive move.
Looking forward, the direction for the next higher degrees will hinge on the development of Gray Wave 4, expected to follow the completion of Gray Wave 3. This indicates that after the impulsive Gray Wave 3 concludes, the market may enter a corrective phase in Gray Wave 4 before potentially resuming its broader trend.
Summary
-
The USD/CAD pair is in a counter-trend phase on the daily chart.
-
Gray Wave 2 has completed, with Gray Wave 3 now in progress.
-
The current market position is within Orange Wave A, part of the impulsive structure.
-
The analysis anticipates Gray Wave 3 to continue unfolding, with a potential move towards Gray Wave 4 in the future.
The analysis remains valid as long as the price does not exceed the wave cancel invalidation level of 1.35738.
USD/CAD Elliott Wave technical analysis
-
Function: Counter Trend.
-
Mode: Corrective.
-
Structure: Navy Blue Wave 4.
-
Position: Gray Wave 3.
-
Next lower degrees direction: Navy Blue Wave 5.
-
Details: Navy Blue Wave 3 appears completed, Navy Blue Wave 4 is currently active and nearing its end.
-
Wave cancel invalidation level: 1.35738.
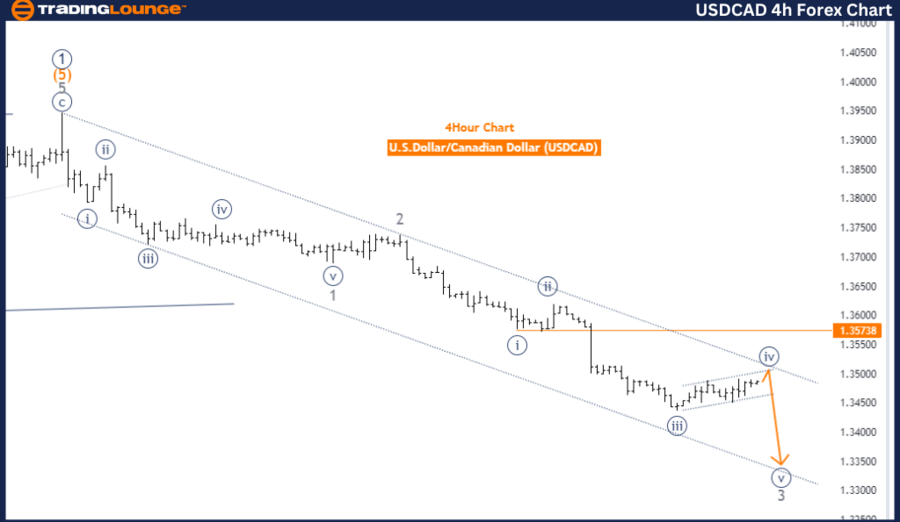
The USD/CAD currency pair is currently in a counter-trend phase, as shown by the Elliott Wave analysis on the 4-hour chart. The market is displaying a corrective mode, which typically happens when the market temporarily moves against the prevailing trend. The primary structure under analysis is Navy Blue Wave 4, which is part of a larger corrective pattern following the completion of the impulsive Navy Blue Wave 3.
At present, the market is positioned within Gray Wave 3 as part of the broader Navy Blue Wave 4. This indicates that the market is in the midst of a corrective phase that is nearing its conclusion. The direction for the next lower degrees will be determined by the upcoming Navy Blue Wave 5, suggesting that once Navy Blue Wave 4 ends, the market may resume its downward movement in Navy Blue Wave 5.
Key points in the analysis highlight that Navy Blue Wave 3 has likely completed. Following this, Navy Blue Wave 4 is currently active and is anticipated to conclude soon. This wave is part of the corrective structure, after which the market may potentially resume its downward trend in Navy Blue Wave 5.
Summary
-
The USDCAD pair is in a corrective phase on the 4-hour chart.
-
Navy Blue Wave 3 has completed, and Navy Blue Wave 4 is currently unfolding.
-
The analysis suggests that Navy Blue Wave 4 is approaching its conclusion.
-
The market may soon transition into Navy Blue Wave 5, indicating a continuation of the broader downward trend.
This analysis remains valid as long as the price does not exceed the wave cancel invalidation level of 1.35738.
USD/CAD Elliott Wave technical analysis [Video]
Author

Peter Mathers
TradingLounge
Peter Mathers started actively trading in 1982. He began his career at Hoei and Shoin, a Japanese futures trading company.


