USD/CAD Elliott Wave technical analysis [Video]
![USD/CAD Elliott Wave technical analysis [Video]](https://editorial.fxstreet.com/images/Markets/Currencies/Majors/USDCAD/canadian-money-2706551_XtraLarge.jpg)
USD/CAD Elliott Wave technical analysis
-
Function: Trend.
-
Mode: Impulsive.
-
Structure: Gray wave 1.
-
Direction Next Lower Degrees: Gray wave 1 (started).
-
Details: Gray wave 5 of 5 completed, now gray wave 1 as a new downtrend started.
-
Wave Cancel Invalid Level: 1.39461.
Analysis
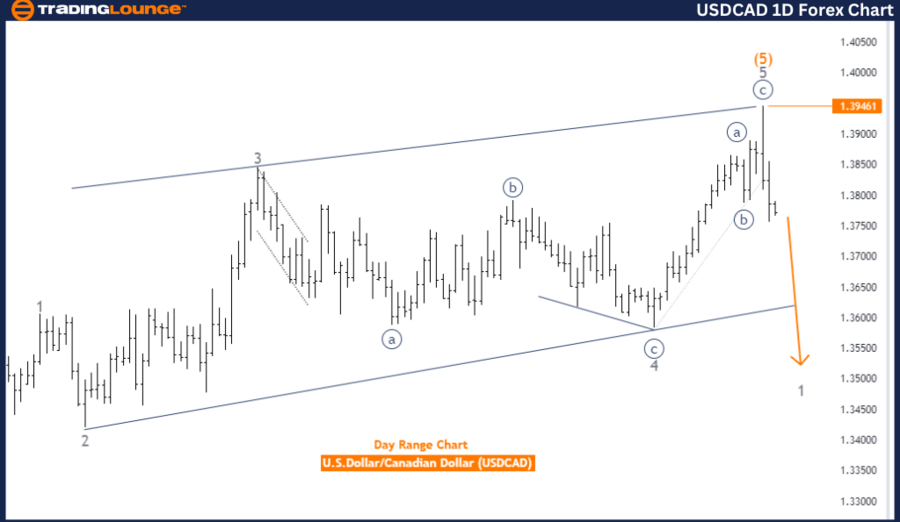
The USD/CAD Elliott Wave Analysis on the daily chart shows the market is currently in a trend mode, specifically characterized by an impulsive wave pattern. The structure identified is gray wave 1, indicating the beginning of a new wave sequence.
In this analysis, the focus is on gray wave 1, which has just started. This suggests the market is in the initial phase of a new impulsive trend. The previous wave, gray wave 5 of 5, appears to be completed, signaling the end of the prior upward trend phase and the start of a new downtrend.
Key points
-
Direction for Next Lower Degrees: Gray wave 1, highlighting the early stages of a new impulsive phase.
-
New Downtrend Phase: Follows the completion of the final wave in the previous trend, marking a significant shift in market direction.
-
Wave Cancel Invalid Level: Set at 1.39461. This level serves as a threshold for the current wave count. If the USD/CAD pair rises above this level, it would invalidate the current wave structure. This event would imply that the anticipated progression from gray wave 5 of 5 to gray wave 1 may not be occurring as expected, necessitating a reevaluation of the wave count and overall market outlook.
Summary
The USD/CAD Elliott Wave Analysis on the daily chart indicates a market transition into a new impulsive trend phase with the initiation of gray wave 1. This follows the completion of gray wave 5 of 5, marking the end of the previous trend and the beginning of a new downtrend. The wave cancellation invalid level at 1.39461 is critical for maintaining the validity of the current wave structure. Any breach of this level would require a reassessment of the wave count and the future direction of the market.
USD/CAD day chart
USD/CAD Elliott Wave technical analysis
- Function: Trend.
-
Mode: Impulsive.
-
Structure: Navy blue wave 3.
-
Position: Gray wave 1.
-
Direction next higher degrees: Navy blue wave 4.
-
Details: Navy blue wave 2 completed, now navy blue wave 3 is in play.
-
Wave cancel invalid level: 1.39461.
Analysis
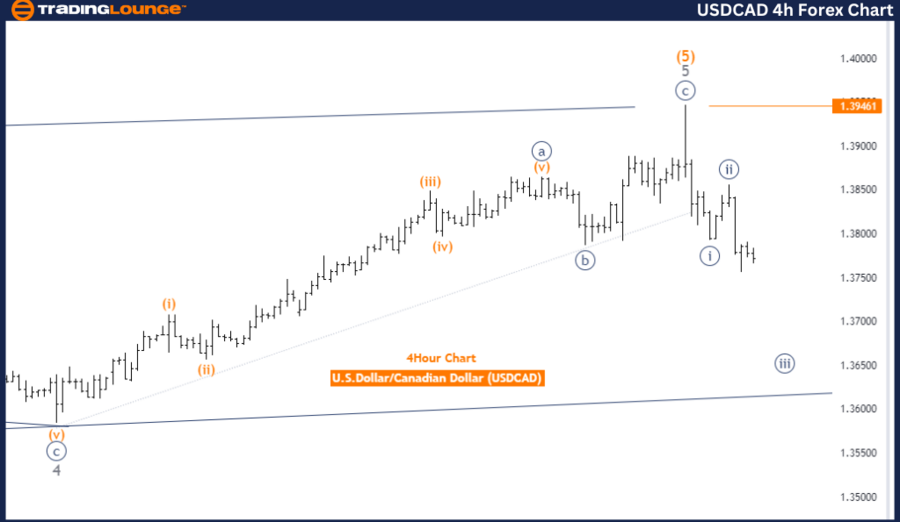
The USD/CAD Elliott Wave Analysis on the 4-hour chart indicates the market is in a trend mode with an impulsive structure. The specific wave pattern identified is navy blue wave 3, suggesting a strong upward movement in the current market phase. The position within this structure is gray wave 1, indicating the market is at the early stage of this impulsive wave sequence.
The analysis details that navy blue wave 2 appears to be completed, and now navy blue wave 3 is in play. This transition from navy blue wave 2 to navy blue wave 3 marks a significant shift from a corrective phase to an impulsive phase, typically associated with strong market movements in the direction of the primary trend.
Key points
-
Direction for Next Higher Degrees: Navy blue wave 4. Once navy blue wave 3 completes, the market will enter a corrective phase of navy blue wave 4 before potentially continuing in the impulsive direction.
-
Wave Cancel Invalid Level: Set at 1.39461. This level acts as a threshold for the current wave count. If the USD/CAD pair drops below this level, the existing wave structure would be invalidated. This would suggest that the anticipated progression from navy blue wave 2 to navy blue wave 3 may not occur as expected, necessitating a reevaluation of the wave count and market outlook.
Summary
The USD/CAD Elliott Wave Analysis on the 4-hour chart shows a market in an impulsive trend phase, with navy blue wave 3 currently in play following the completion of navy blue wave 2. The market is expected to move through navy blue wave 3, eventually entering a corrective phase of navy blue wave 4. The wave cancel invalid level at 1.39461 is crucial for maintaining the validity of the current wave structure. Any breach of this level would require a reassessment of the wave count and the market's future direction.
USD/CAD four-hour chart
USD/CAD Elliott Wave technical analysis [Video]
Author

Peter Mathers
TradingLounge
Peter Mathers started actively trading in 1982. He began his career at Hoei and Shoin, a Japanese futures trading company.


