USD/CAD Elliott Wave technical analysis [Video]
![USD/CAD Elliott Wave technical analysis [Video]](https://editorial.fxstreet.com/images/Markets/Currencies/Majors/USDCAD/canadian-dollar-closeup-29758764_XtraLarge.jpg)
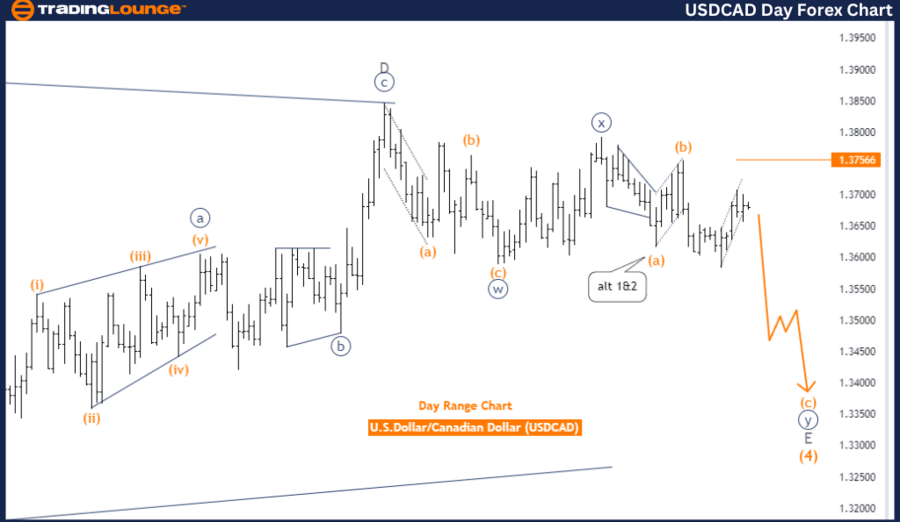
USD/CAD Daily Chart Analysis.
USD/CAD Elliott Wave technical analysis
Function: Counter Trend.
Mode: Impulsive.
Structure: Orange Wave C.
Position: Navy Blue Wave Y of E.
Next higher degree direction: New Wave 1.
Wave cancellation invalid level: 1.37566.
The USD/CAD Elliott Wave analysis for the daily chart aims to understand counter-trend movements using Elliott Wave Theory. This analysis helps identify market patterns and phases. It focuses on tracking a counter-trend movement, indicating the current market direction is against the broader trend. The mode is impulsive, suggesting strong and decisive price action despite being in a counter-trend.
The specific wave structure under observation is Orange Wave C, part of a broader Navy Blue Wave Y of E. This indicates the market is undergoing a significant movement within the counter-trend phase. Currently, the market is positioned in Navy Blue Wave Y of E, indicating the completion of earlier waves and the start of the final leg in this corrective pattern.
The next higher degree direction suggests the initiation of a new Wave 1. After completing the current corrective phase, the market is expected to start a new impulsive wave, indicating a potential trend reversal or continuation in a new direction.
Details of the analysis show that Orange Wave B of Wave Y appears completed. Now, Orange Wave C of Y is in play. This phase represents the final corrective wave within the broader Navy Blue Wave Y, characterized by decisive price action following the correction established by Orange Wave B.
A crucial aspect of this analysis is the wave cancellation invalid level, set at 1.37566. This level is a critical reference point for validating or invalidating the current wave count. If the market price moves beyond this level, it would invalidate the current wave analysis, necessitating a reassessment of the market's wave structure. This invalidation level is essential for risk management and ensuring the accuracy of the wave analysis.
In summary, the USD/CAD daily chart analysis indicates the market is in an impulsive counter-trend phase within Orange Wave C of Navy Blue Wave Y of E. The analysis anticipates the continuation of the corrective phase through Orange Wave C, following the completion of Orange Wave B. The wave cancellation invalid level at 1.37566 is crucial for maintaining the validity of the current wave analysis and effective risk management.
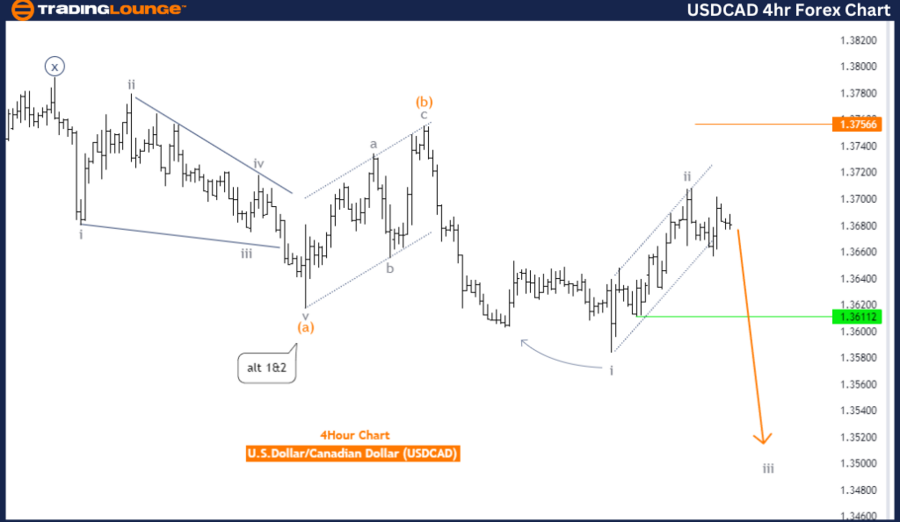
USD/CAD 4-Hour Chart Analysis.
USD/CAD Elliott Wave technical analysis
Function: Counter Trend.
Mode: Impulsive.
Structure: Gray Wave 3.
Position: Orange Wave C.
Next lower degree direction: Gray Wave 3 (started).
Wave cancellation invalid level: 1.37566.
The USD/CAD Elliott Wave analysis for the 4-hour chart aims to understand counter-trend movements within the market using Elliott Wave Theory. This analysis helps identify market patterns and phases. It focuses on tracking a counter-trend movement, indicating the current market direction is against the broader trend. The mode is impulsive, signifying strong and decisive price action despite being in a counter-trend.
The specific wave structure under observation is Gray Wave 3, which is part of a broader Orange Wave C. This suggests the market is undergoing a significant movement within the counter-trend phase. Currently, the market is positioned in Orange Wave C, a corrective wave in the Elliott Wave cycle. This indicates the market is experiencing a corrective phase, following impulsive waves and typically retracing part of the previous trend.
The next lower degree direction continues with Gray Wave 3, which has already commenced. This continuation implies that the corrective phase is expected to persist following the completion of Gray Wave 2.
Details of the analysis reveal that Gray Wave 2 of Wave C appears completed. Now, Gray Wave 3 of C is in play. This phase represents a continuation of the counter-trend movement, characterized by decisive price action following the correction established by Gray Wave 2.
A crucial aspect of this analysis is the wave cancellation invalid level, set at 1.37566. This level is a critical reference point for validating or invalidating the current wave count. If the market price moves beyond this level, it would invalidate the current wave analysis, necessitating a reassessment of the market's wave structure. This invalidation level is essential for risk management and ensuring the accuracy of the wave analysis.
In summary, the USD/CAD 4-hour chart analysis indicates the market is in an impulsive counter-trend phase within Gray Wave 3 of Orange Wave C. The analysis anticipates the continuation of the corrective phase through Gray Wave 3, following the completion of Gray Wave 2. The wave cancellation invalid level at 1.37566 is crucial for maintaining the validity of the current wave analysis and effective risk management.
Technical analyst: Malik Awais.
USD/CAD Elliott Wave technical analysis [Video]
Author

Peter Mathers
TradingLounge
Peter Mathers started actively trading in 1982. He began his career at Hoei and Shoin, a Japanese futures trading company.


