USD/CAD Elliott Wave technical analysis [Video]
![USD/CAD Elliott Wave technical analysis [Video]](https://editorial.fxstreet.com/images/Markets/Currencies/Majors/USDCAD/five-dollar-bills-9087891_XtraLarge.jpg)
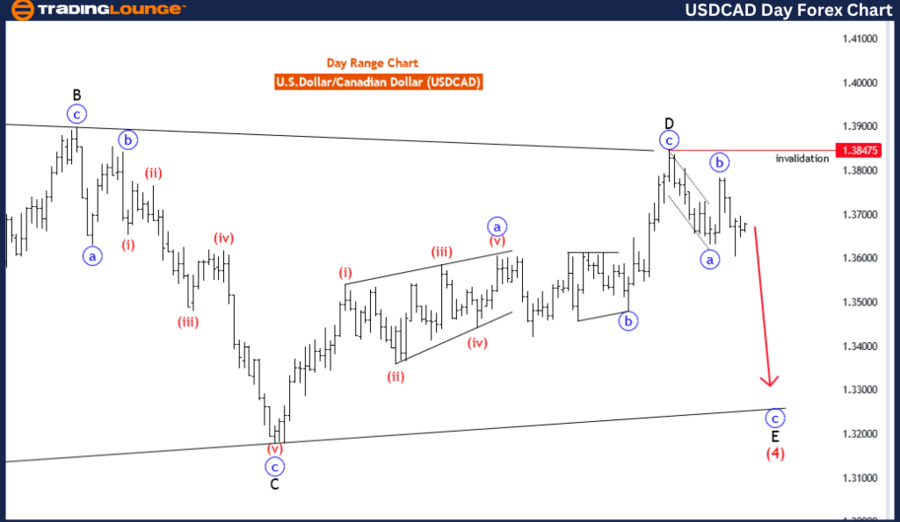
USD/CAD Elliott Wave technical analysis
Function: Counter Trend.
Mode: Corrective.
Structure: Blue wave C.
Position: Black wave E of triangle.
Direction next higher degrees: Red wave 5.
Details: Blue wave B of E completed at 1.37858, now blue wave C is in play.
Wave cancel invalid level:1.38457
The USD/CAD Elliott Wave Analysis for the Day Chart examines the movement of the U.S. Dollar against the Canadian Dollar using Elliott Wave theory, with a focus on the current corrective pattern and its potential implications for future trends.
Function: The function of this analysis is identified as "Counter Trend," indicating that the overall market movement is currently in a correction phase, suggesting that the broader primary trend may be in the process of reversing or pausing.
Mode: The mode is described as "Corrective," indicating that the current pattern consists of complex and layered movements typically associated with Elliott Wave's corrective waves. This mode signifies the presence of wave patterns that do not follow straightforward upward or downward trends, often indicating a pause or consolidation in the market.
Structure: The structure is characterized as a "blue wave C" within a "black wave E of triangle." This structure represents a complex pattern where a triangle formation indicates consolidation and typically leads to a breakout in the final wave, indicating potential directional movement. In this case, the analysis suggests that the market is in the final corrective wave of the triangle.
Position: The current position in the wave structure is within the "black wave E of triangle," suggesting that the market is approaching the end of a larger consolidation pattern. This position typically leads to a breakout, indicating a potential directional shift once the triangle completes.
Direction for the next higher degrees: The direction for the next higher degrees is identified as "red wave 5," suggesting that once the current corrective phase within the triangle concludes, the broader trend may resume, leading to an impulsive movement in the market.
Details: The details section provides specific insights into the ongoing corrective phase. It indicates that "blue wave B of E" completed at 1.37858, suggesting that the second wave of the triangle has finished, leading to the current "blue wave C" in play. The wave cancellation or invalidation level is set at 1.38457, indicating a critical threshold above which the current pattern would be invalidated, suggesting a re-evaluation of the Elliott Wave structure.
In summary, the USD/CAD Elliott Wave Analysis for the Day Chart shows a corrective pattern with a triangle structure in the "black wave E," leading to the final "blue wave C" in play. The completion of this wave may signal a broader trend change, leading to the final red wave 5. The Wave Cancel invalid level at 1.38457 indicates a critical level to watch, suggesting the possible invalidation of the current wave structure if exceeded.
USD/CAD four-hour chart
Function: Counter Trend
Mode: Impulsive
Structure: Red wave 2
Position: Blue wave C
Direction next lower degrees: Red wave 3
Details: Red wave 1 of C completed at 1.36031, now red wave 2 is in play . Wave Cancel invalid level:1.38457
The USD/CAD Elliott Wave Analysis for the 4-Hour Chart offers a technical perspective on the U.S. Dollar against the Canadian Dollar, using Elliott Wave theory to assess the market structure, current positioning, and potential future trends.
Function: The function of this analysis is identified as "Counter Trend," indicating that the broader market movement is currently in a corrective phase, potentially against a larger primary trend. This suggests that the current wave structure is temporary and is part of a broader Elliott Wave cycle.
Mode: The mode is described as "impulsive," indicating that the current corrective phase consists of clear, directional movements typically associated with an Elliott Wave pattern. This mode suggests strong moves within the corrective phase, often leading toward a key reversal point.
Structure: The structure is categorized as "red wave 2," which is part of a broader pattern that is expected to reverse the current counter trend. This structure indicates that the correction might include smaller waves within it, showing potential changes in market momentum.
Position: The position within the structure is "blue wave C," suggesting that the current pattern is in the final stage of a larger correction, typically composed of three sub-waves. The completion of this wave might indicate a potential return to a broader impulsive trend.
Direction for the next lower degrees: The direction for the next lower degrees is "red wave 3," indicating that once the current corrective phase concludes, the market is expected to resume an upward trajectory as part of the impulsive pattern.
Details: The details section provides key insights into the current state of the wave pattern. It indicates that "red wave 1 of C" completed at 1.36031, suggesting the end of a sub-wave. The current focus is on "red wave 2," which is in play, potentially nearing its completion. The Wave Cancel invalid level is set at 1.38457, indicating that if the market moves above this level, the current wave structure would be invalidated, requiring a re-evaluation of the Elliott Wave pattern.
In summary, the USD/CAD Elliott Wave Analysis for the 4-Hour Chart suggests that the market is currently in a corrective phase ("red wave 2") within a broader impulsive structure ("blue wave C"). The completion of "red wave 1" indicates the start of "red wave 2," which is currently in play. Once completed, the market is expected to move into "red wave 3," suggesting a potential upward trend. The Wave Cancel invalid level of 1.38457 serves as a critical point for confirming the current wave structure.

USD/CAD Elliott Wave technical analysis [Video]
Author

Peter Mathers
TradingLounge
Peter Mathers started actively trading in 1982. He began his career at Hoei and Shoin, a Japanese futures trading company.


