USD/CAD Elliott Wave Analysis
USD/CAD – 1.3643
USD/CAD – Wave v ended at 0.9407 and a-b-c correction may extend gain to 1.4700
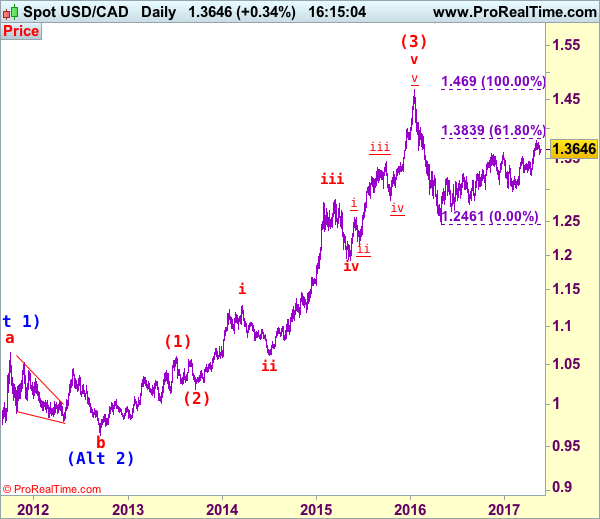
As the greenback has retreated after rising to 1.3794, suggesting consolidation below this level would take take place and initial downside risk is for pullback to 1.3570 and possibly towards 1.3520-25, however, reckon downside would be limited from there and bring rebound later, above 1.3720-25 would suggest the pullback from 1.3794 has ended, bring test of 1.3770 resistance but break there is needed to signal recent upmove has resumed for retest of 1.3794, break there would extend the erratic rise from 1.2461 low for at least a strong correction of the fall from 1.4690 (2016 high) to 1.3800 and later 1.3835-40 (61.8% Fibonacci retracement of 1.4690-1.2461), however, overbought condition would limit upside to 1.3890-00 and price should falter well below psychological resistance at 1.4000, bring retreat later.
We are keeping our view that the wave b from 1.0657 (a leg top) has possibly ended at 0.9633 with (a): 0.9800, wave (b): 1.0447 and wave c at 0.9633, the subsequent rise from there is now treated as wave c exceeded indicated upside target at 1.3770-80 and 1.4000 and wave (3) has possibly ended at 1.4690 and wave (4) correction has commenced for retracement back to 1.2832 support, then 1.2410-20.
On the daily chart, our latest preferred count remains that the A of (B) rally from 0.9059 low (7 Nov 2007) unfolded into an impulsive wave with i: 0.9059-1.0380, ii ended at 0.9819, iii at 1.3019 followed by triangle wave iv at 1.2026 , then wave v formed a top at 1.3066 and also ended the wave A. The wave B is unfolding as an double three a-b-c-x-a-b-c and is sub-divided as a: 1.2192, b: 1.2716 and wave c at 1.0784, followed by wave x at 1.1725, another set of a-b-c unfolded with 2nd a at 0.9931, 2nd b at 1.0674. the 2nd c has possibly ended at 0.9407, therefore, consolidation with upside bias is seen for major correction, indicated target at 1.3900 had been met and gain to 1.4700 would follow.
On the downside, whilst pullback to 1.3570 cannot be ruled out, reckon downside would be limited and support at 1.3530 should remain intact, bring another rise later. A daily close below 1.3530 would defer and suggest top is possibly formed, risk weakness to 1.3450-60 but break of indicated support at 1.3411 is needed to add credence to this view, bring further fall to 1.3380-85, then 1.3335-40.
Recommendation: Exit long entered at 1.3650 and stand aside for this week.
For trade ideas for a shorter time frame, please refer to the Elliott Wave Daily Trade Idea section.
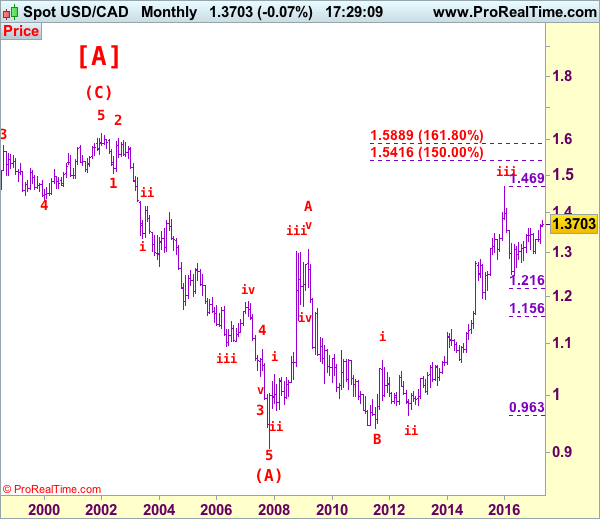
Longer term - The selloff from 1.6194 (21 Jan 2002) to 0.9059 (07 Nov 2007) is viewed as (A) wave which is a 5-waver as labeled on the monthly chart as below, the subsequently rally is labeled as (B) with impulsive A leg of (B) ended at 1.3066, wave B of (B) is unfolding which has either ended at 0.9407 or would extend one more fall but downside should be limited to 0.9200 and 0.9000 should hold.
Interested in USD/CAD technicals? Check out the key levels
Author

Ben Wong
ActionForex.com
Ben Wong has been in charge of Action Forex’s “Trade Idea” department for 10 years, providing reliable trading recommendations to traders around the world.


