USD/CAD produced two bullish candles consecutively on the daily chart after consolidation. Yesterday’s daily candle closed within a flipped resistance. If the price keeps going towards the North and makes a daily breakout at the level of resistance, the buyers may remain busy in buying the pair for some days. Major intraday charts such as the H4 chart looks suitable for the buyers too. However, the H1 chart looks a bit choppy. Let us have a look at the Daily-USD/CAD chart.
Chart 1 USD/CAD Daily Chart
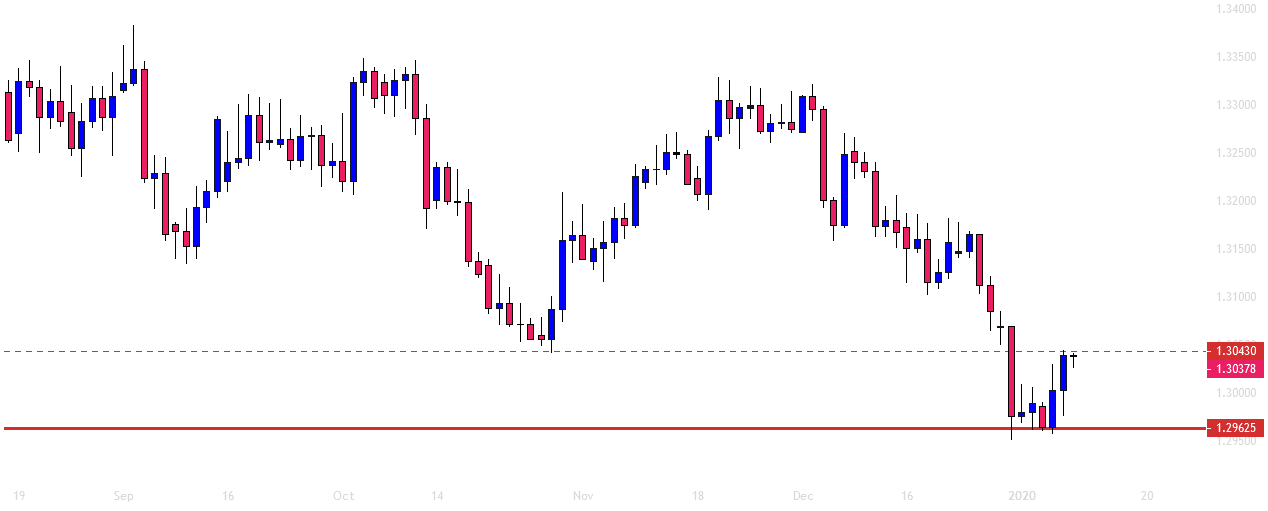
The chart shows that the price headed towards the South with good bearish momentum. It has found its support at the level of 1.29625 and consolidated for a while. Upon producing a bullish engulfing candle, it headed towards the upside yesterday as well. The candle closed within the level of 1.30430, which is a flipped resistance. If the price makes a daily breakout at this level, the buyers may go long on the pair up to the level of 1.33090.
Chart 2 USD/CAD H4 Chart
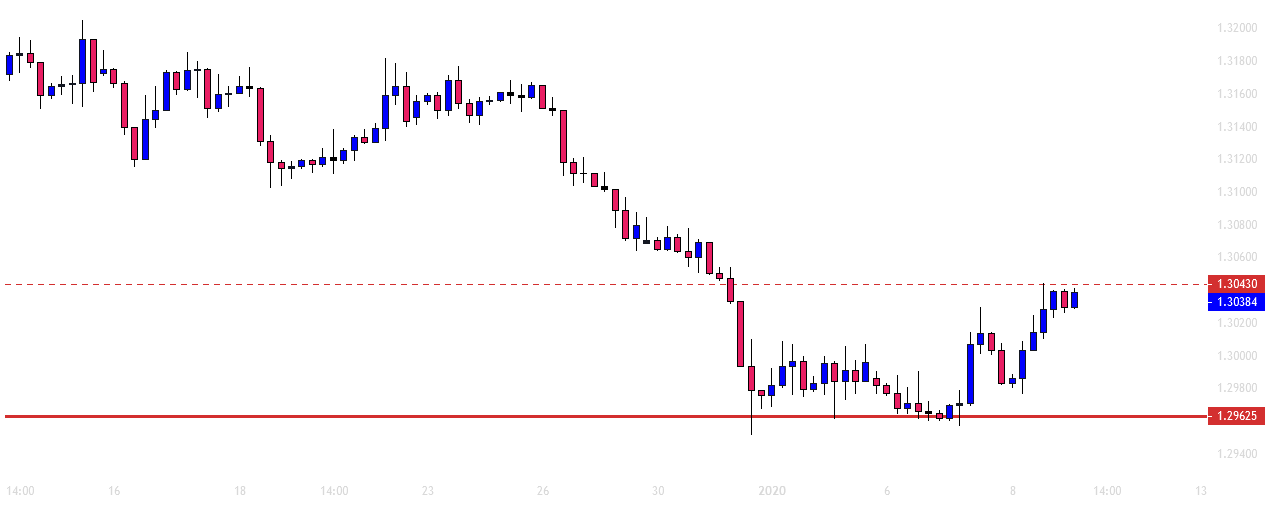
The H4 shows that the price has been on consolidation. As of writing, the price has been bullish on the last candle. If the candle closes above the level of 1.30430, the price may head towards the upside. It may find its next resistance at the level of 1.31120. Since the daily chart is bullish biased, the H4 buyers may hold their partial positions to hunt more pips. If the price breaches the level of 1.31120, it may go towards the level of 1.31675. This is the level where the H4 chart may make a long consolidation.
Chart 3 USD/CAD H1 Chart
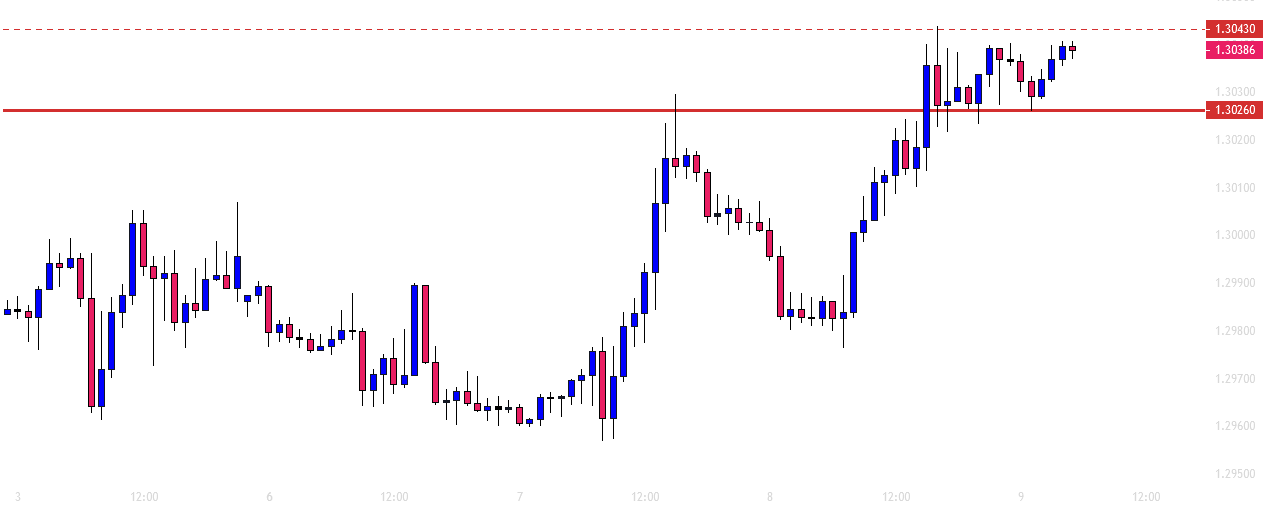
The chart shows that the price gets caught within two horizontal levels. It bounced at the level of 1.30260 twice. On the other hand, it had rejection three times at the level of 1.30430. In a word, it is going to be a strong battle. Since the daily and the H4 are bullish biased, the H1 chart may make an upside breakout. The price may find its next resistance at the level of 1.30880, which offers a lucrative risk-reward to the H1 buyers. On the other hand, triple top resistance may drive the price towards the downside and make a breakout at the level of support. In case of a bearish breakout, the price may find its next support at the level of 1.29800.
Considering these three charts, it seems that the buyers have the upper hand. A lot depends on the intraday charts. If today’s intraday charts get bullish and end up producing a daily bullish candle, USD/CAD may become a buyer's territory.
Risk Warning: CFD and Spot Forex trading both come with a high degree of risk. You must be prepared to sustain a total loss of any funds deposited with us, as well as any additional losses, charges, or other costs we incur in recovering any payment from you. Given the possibility of losing more than your entire investment, speculation in certain investments should only be conducted with risk capital funds that if lost will not significantly affect your personal or institution’s financial well-being. Before deciding to trade the products offered by us, you should carefully consider your objectives, financial situation, needs and level of experience. You should also be aware of all the risks associated with trading on margin.
Recommended Content
Editors’ Picks
EUR/USD retreats toward 1.0850 as mood sours

EUR/USD stays under modest bearish pressure and declines toward 1.0850 on Tuesday. The US Dollar benefits from safe haven flows and weighs on the pair as investors adopt a cautious stance ahead of this week's key earnings reports and data releases.
GBP/USD stays pressured toward 1.2900 as US Dollar stabilizes

GBP/USD is on the defensive toward 1.2900, struggling to find a foothold on Tuesday. The US Dollar holds steady following Monday's pullback amid a negative shift seen in risk sentiment, not allowing the pair to regain its traction.
Gold recovers above $2,400 as US yields retreat

Gold stages a rebound and trades above $2,400 on Monday after closing the fourth consecutive trading day in negative territory on Monday. The pullback seen in US Treasury bond yields help XAU/USD stretch higher despite the US Dollar's resilience.
Bitcoin price struggles around $67,000 as US Government transfers, Mt. Gox funds movement weigh

Bitcoin struggles around the $67,000 mark and declines by 1.7% at the time of writing on Tuesday at around $66,350. BTC spot ETFs saw significant inflows of $530.20 million on Monday.
Big tech rebound ahead of earnings, Oil slips
/stock-market-graph-gm532464153-55981218_XtraSmall.jpg)
Tesla and Google are due to report earnings today after the bell, and their results could shift the wind in either direction. Despite almost doubling its stock price between April and July, Tesla sees appetite for its cars and its market share under pressure.