US yields vs DXY: A divergence unfolds as Gold tests critical support

Market divergence: US yields drop while DXY and Gold face key levels
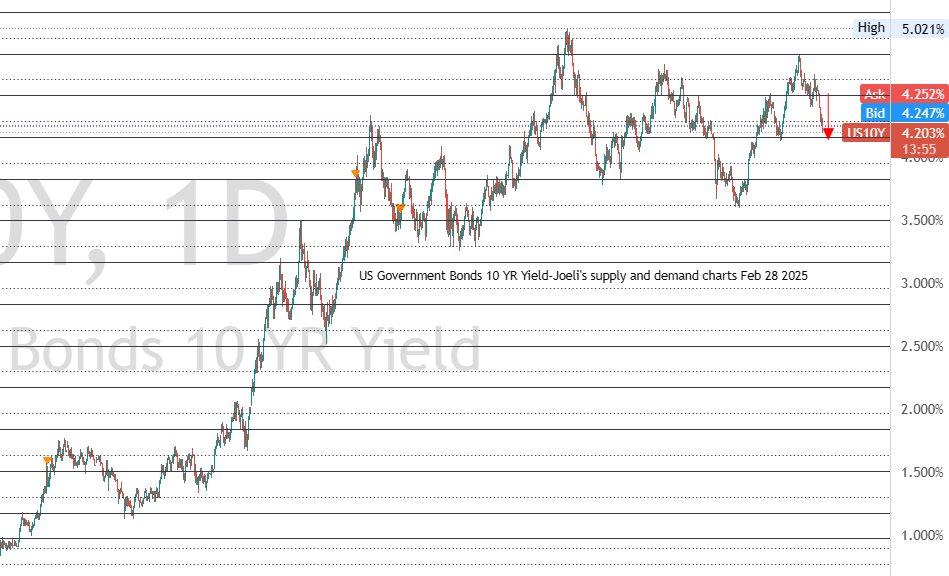
As February 2025 comes to a close, a notable divergence is unfolding in the financial markets: the 10-year US Treasury yield (US10Y) has declined for six consecutive sessions, falling more than 6% since dropping below 4.50% and closing February with a total loss of more than 9%. The next critical support sits at 4.16%, which aligns with December 2024 support. A break below could signal further downside, while a bounce could indicate stabilization.
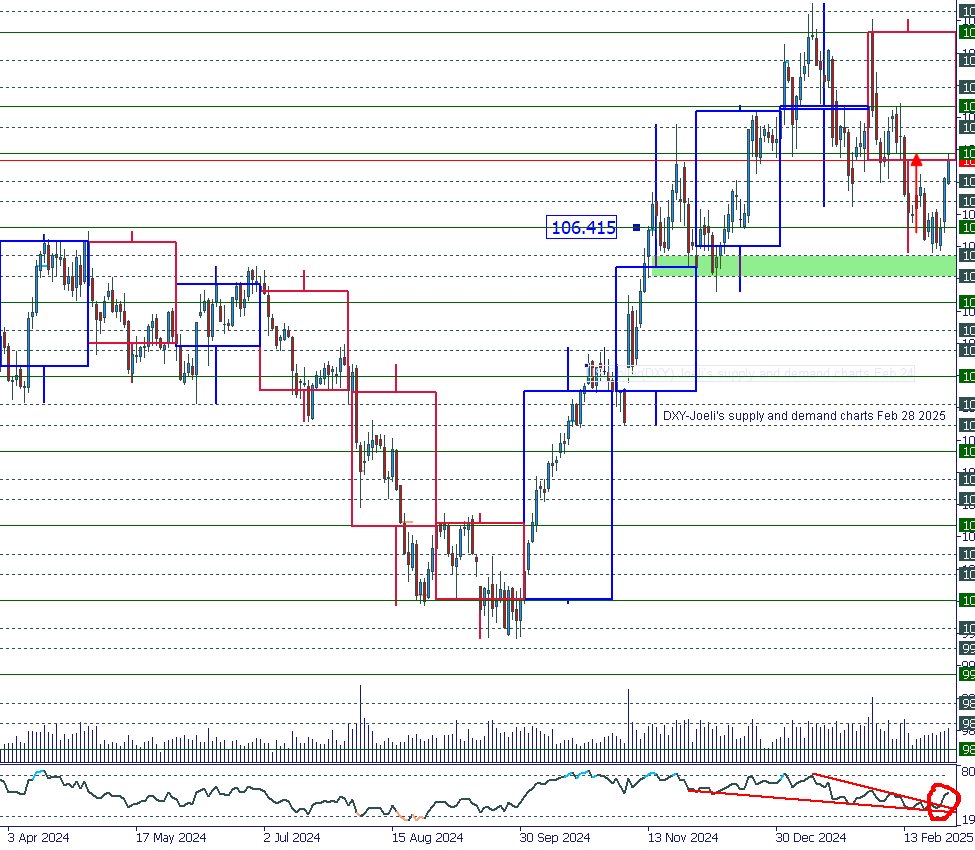
Meanwhile, the US Dollar Index (DXY) has rebounded sharply, recovering from a dip below 106.41 and approaching a major resistance zone at 107.60. A falling wedge pattern in the RSI, visible on both the daily and monthly charts since January 2025, has broken out in the oversold area, suggesting a potential further upside toward 108.00 and 108.34, provided it holds above 107.60. The coming sessions will set the pace for March and the future direction of the DXY.
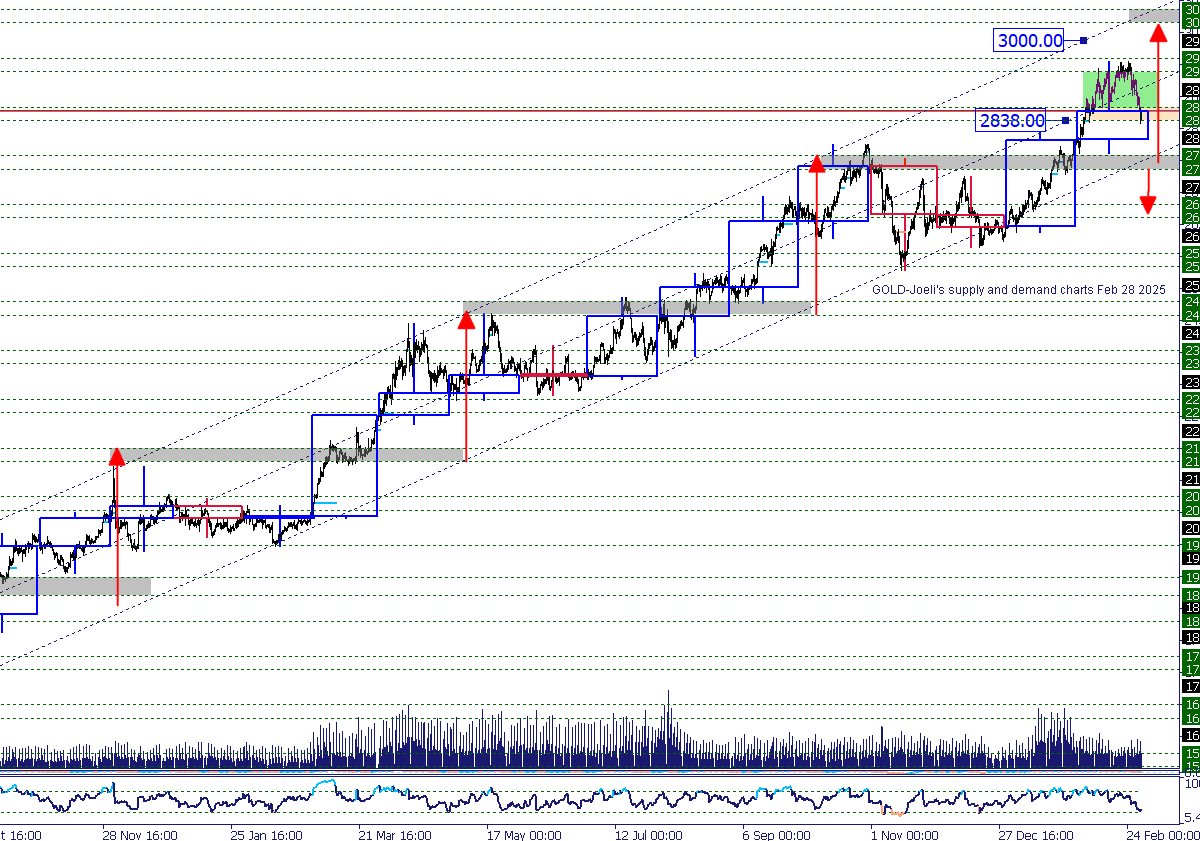
At the same time, Gold has retreated from its recent high of $2,936, closing within the $2,838 support zone after a four-day decline of nearly 3%. Despite this Pullback, Gold closed February positively, and the seventeen-month bullish price channel that began in October 2023 remains intact. Similar breakout patterns have occurred within this long-term channel, with one previous instance in October 2024 pulling back to its lower boundary before rebounding higher.
This divergence raises an important question: Why is the US dollar strengthening even as yields decline, and what does this mean for Gold? Traditionally, a drop in yields weakens the dollar, yet the current market dynamic suggests broader fundamental and technical forces at play.
With global trade tensions escalating due to proposed US tariffs on Canada, Mexico, China, and the EU and mixed US economic data influencing rate expectations, market participants are closely watching how these key assets interact. This analysis will delve into the technical and fundamental drivers behind this divergence and outline potential scenarios for the coming weeks.
Technical analysis of the 10-year US Treasury yield
-
Recent price action: The yield has fallen more than 6% in six days since breaking below 4.50%, closing February with a 9% loss.
-
Key support & resistance levels: The next major support sits at 4.16%, aligning with December 2024 support. A break below could signal further downside, while a bounce could indicate stabilization.
-
Indicators & patterns: RSI and MACD suggest the yield is approaching oversold conditions, but fundamental drivers remain in focus.
DXY: Strength amid falling yields?
-
Price action review: After dipping below 106.415, DXY has bounced back and is testing resistance at 107.605.
-
Technical outlook: A falling wedge breakout in RSI (daily and monthly charts) signals the potential for further upside. If 107.60 holds, DXY could target 108.00 and 108.34 in the coming sessions.
-
Market drivers: Safe-haven flows, Fed rate expectations, and geopolitical concerns.
Gold's reaction to market moves
-
Gold's pullback from $2,936 to $2,838 Support
-
Inverse correlation with DXY: A stronger dollar has pressured gold prices lower.
-
Key support & resistance: If $2,838 holds, a rebound may follow. However, a failure to hold could see gold retreat further to $2,800 (February opening level) and potentially to $2,741, the bottom of the long-term bullish price channel.
-
Long-term trend: Despite the recent decline, the seventeen-month bullish channel remains intact. Similar past patterns suggest that if Gold holds at $2,741, a renewed uptrend toward $3,000 and $3,034 could emerge.
-
RSI levels: Gold is oversold on the daily and monthly charts.
Conclusion: What traders should watch
As markets enter March, traders must watch whether US10Y finds support at 4.16%, DXY breaks 107.60 resistance, and Gold holds above $2,838. If Gold declines further, $2,741 remains the critical support level to maintain the long-term bullish structure. With fundamental risks like tariffs, inflation data, and central bank actions looming, volatility is expected.
Author

Denis Joeli Fatiaki
Independent Analyst
Denis Joeli Fatiaki possesses over a decade of extensive experience as a multi-asset trader and Market Strategist.


