US service sector strength or weakness? Let's review conflicting reports

There are hugely conflicting reports on the strength of US services. Let's take a look.
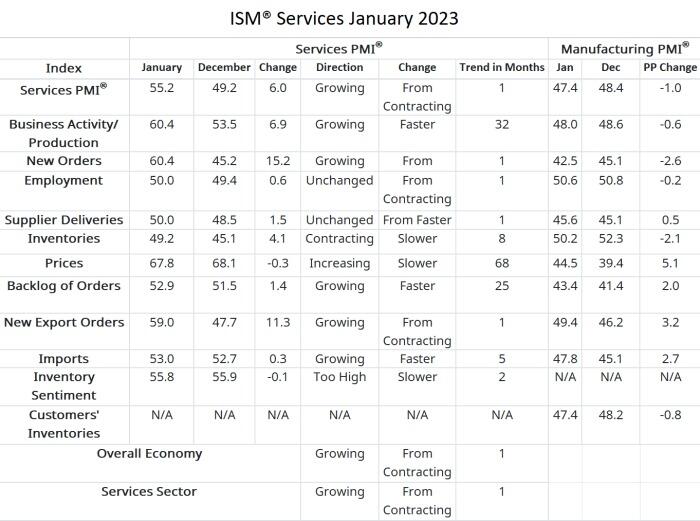
Source: Supply Management ® ISM®
“In January, the Services PMI® registered 55.2 percent, 6 percentage points higher than December’s seasonally adjusted reading of 49.2 percent. The composite index grew in January after contracting in December for the first time since May 2020, when it registered 45.4 percent (seasonally adjusted). The Business Activity Index registered 60.4 percent, a 6.9-percentage point increase compared to the seasonally adjusted reading of 53.5 percent in December. The New Orders Index grew in January after contracting in December for the first time since May 2020; the figure of 60.4 percent is 15.2 percentage points higher than the seasonally adjusted December reading of 45.2 percent."
A caution about diffusion indexes
The ISM and S&P reports are diffusion indexes, signaling direction not amount. For example a firm hiring 10 workers and a firm laying off 200 workers balances out.
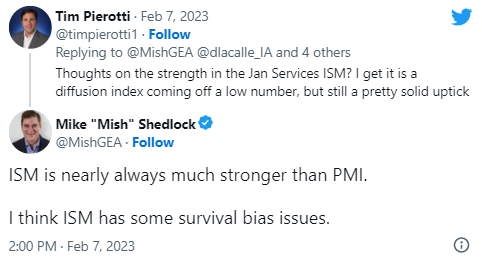
Diffusion indexes have issues. There is a survival bias and a weighting bias.
Let's see what other indexes suggest about services.
S&P 500 global US services PMI™
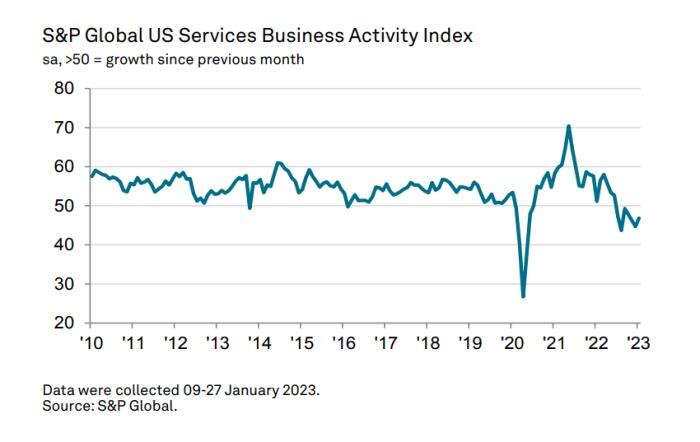
Business activity contraction eases at start of 2023, but cost pressures strengthen once again.
January data signaled a solid contraction in business activity across the US service sector at the start of 2023, according to the latest PMI™ data. Although easing, the fall in output stemmed from further weak domestic and external demand conditions, as new business and new export orders declined. Firms continued to expand their workforce numbers despite another fall in backlogs of work, but the pace of employment growth slowed further amid reports of cost-cutting efforts. Nonetheless, business confidence strengthened and was buoyed by increased spending on marketing and investment in cost efficiency. At the same time, cost inflation picked up for the first time in eight months. A sharper rise in input prices was not reflected in a quicker increase in output charges, however, as selling prices rose at the slowest pace since October 2020.
Chris Williamson, chief business economist at S&P 500 global market intelligence
- "Business activity in the vast US services economy contracted in January as companies reported a further deterioration in new business inflows. Hiring has almost ground to halt as firms reassess their payroll needs in the light of the weaker demand environment.
- "The downturn is being led by a slump in financial services activity, linked in turn to higher borrowing costs, with consumer-facing service providers also reporting especially tough business conditions amid the ongoing squeeze in spending due to the rising cost of living.
- "Combined with the fall in manufacturing output recorded during the month, the service sector’s downturn at the start of the year adds to the risk that the US economy could contract in the first quarter.
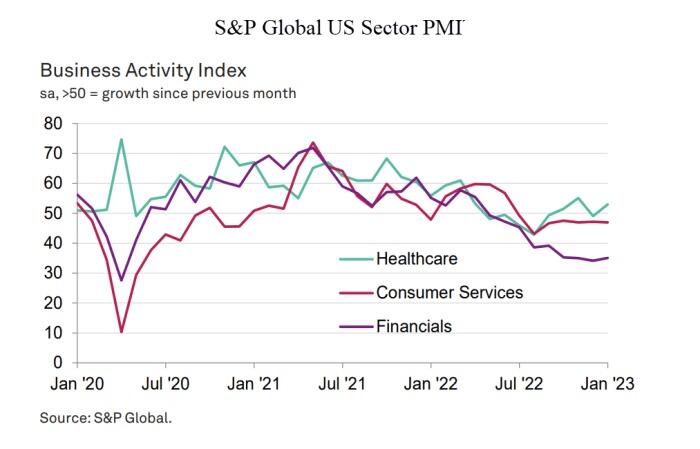
S&P 500 global US sector PMI™
Key findings
-
Five out of seven sectors register lower output in January.
-
Financials report by far the fastest fall in business activity.
-
Healthcare and Technology growth contrasts with declines elsewhere.
US Sector PMI™ indices are compiled from responses to questionnaires sent to purchasing managers in S&P Global's US manufacturing and services PMI survey panels, covering over 1,000 private sector companies. Indices are available for the basic materials, consumer goods, consumer services, financials, healthcare, industrials and technology sectors.
January data pointed to falling business activity in five of the seven sectors monitored by S&P Global US Sector PMI data, although rates of contraction varied considerably. Financials (index at 35.0) saw by far the steepest downturn in business activity, while the Consumer Services sector (46.9) experienced the least marked decline.
Financials has been the worst-performing category in each month since June 2022, largely reflecting subdued client demand in the wake of higher borrowing costs and heightened economic uncertainty. The downturn eased only slightly after the near-record reduction in business activity seen during the previous month.
Meanwhile, relatively sharp declines in production volumes were recorded across the Basic Materials and Consumer Goods sectors at the start of 2023. The downturn in Basic Materials output now stretches to seven consecutive months.
Consumer Services also recorded a decline in business activity for the seventh month in a row, which survey respondents mostly attributed to pressure on household finances from elevated inflation.
Whom to believe?
Which set or reports (two by S&P or one by ISM) rings true?
- If you are in Fantasyland then ISM looks correct.
- If you reside in the real world, watching declining consumer spending in all categories, you are more likely to place some faith in the S&P reports.
Welcome to the global recession
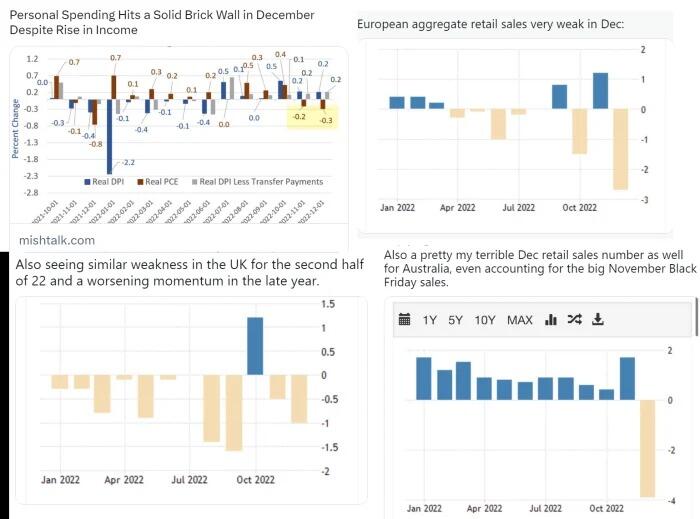
Consumer spending hit a brick wall in the US, EU, UK and Australia. Guess what that means.
With consumer spending falling off the cliff, how long will jobs stay strong? Strong enough to prevent a recession that history suggests has already started?
In Wonderland, jobs will save the day, assuming you believe the December Jobs data, but I don't.
Author

Mike “Mish” Shedlock's
Sitka Pacific Capital Management,Llc


