US Q3 GDP Preview: Dollar bears to retain control on weak GDP print
- US economy is forecast to grow at an annual rate of 2.4% in Q3.
- Investors reassess Fed’s policy outlook following dismal US data.
- DXY technical picture points to a bearish tilt.

The US Bureau of Economic Analysis will release its first estimate of the third-quarter Gross Domestic Product (GDP) on Thursday, October 27. Markets forecast the US economy to expand at an annualized rate of 2.4% following the 0.6% contraction recorded in the second quarter.
The Federal Reserve Bank of Atlanta’s latest GDPNow estimate, published on October 19, however, showed that the GDP is expected to grow by 2.9% in Q3. Following the Federal Reserve’s decision to hike the policy rate by 75 basis points (bps) in September, policymakers have acknowledged the heightened risks of an economic downturn but reiterated that they will remain focused on taming inflation until they see a consistent increase in the unemployment rate – full employment being another of their key mandates. In the Summary of Economic Projections released alongside the policy statement, Fed officials projected the GDP to grow by 0.2% in 2022 and 1.2% in 2023.
Market implications
Nick Timiraos, The Wall Street Journal’s chief economics correspondent who correctly leaked the 75 bps hike a few days before the July policy meeting, wrote recently that policymakers were planning to communicate smaller rate hikes from December.
The disappointing S&P Global PMI surveys revealed earlier in the week that the economic activity in the private sector contracted at an accelerating pace in early October, triggering a dollar sell-off. Additionally, the Conference Board’s sentiment survey revealed that consumer confidence deteriorated in October, causing the greenback to continue to weaken against its major rivals.
Dismal US data releases following Timiraos’ article seem to have revived expectations for the Fed to adopt a less aggressive policy stance. According to the CME Group FedWatch Tool, markets are pricing in a more than 50% probability of the US central bank raising the policy rate by a total of 125 bps by the end of the year, compared to only 20% last week.
As mentioned above, FOMC officials are unlikely to put too much weight on the GDP report when assessing the policy outlook. However, the market reaction to the latest US data, which had not been big market movers in the past, suggests that investors might be looking for an excuse to get out of their dollar longs while re-evaluating their positions ahead of the Fed’s policy announcements on November 2. Hence, a Q3 GDP reading slightly below or at the market projection of 2.4% could force the dollar to stay on the backfoot after the kneejerk reaction, while a print below 2% could open the door for another sharp decline in the US Dollar Index (DXY). On the other hand, a GDP growth at around the Atlanta Fed’s estimate of 2.9% should help USD stay resilient against its peers, at least until next week’s Fed meeting.
DXY technical outlook
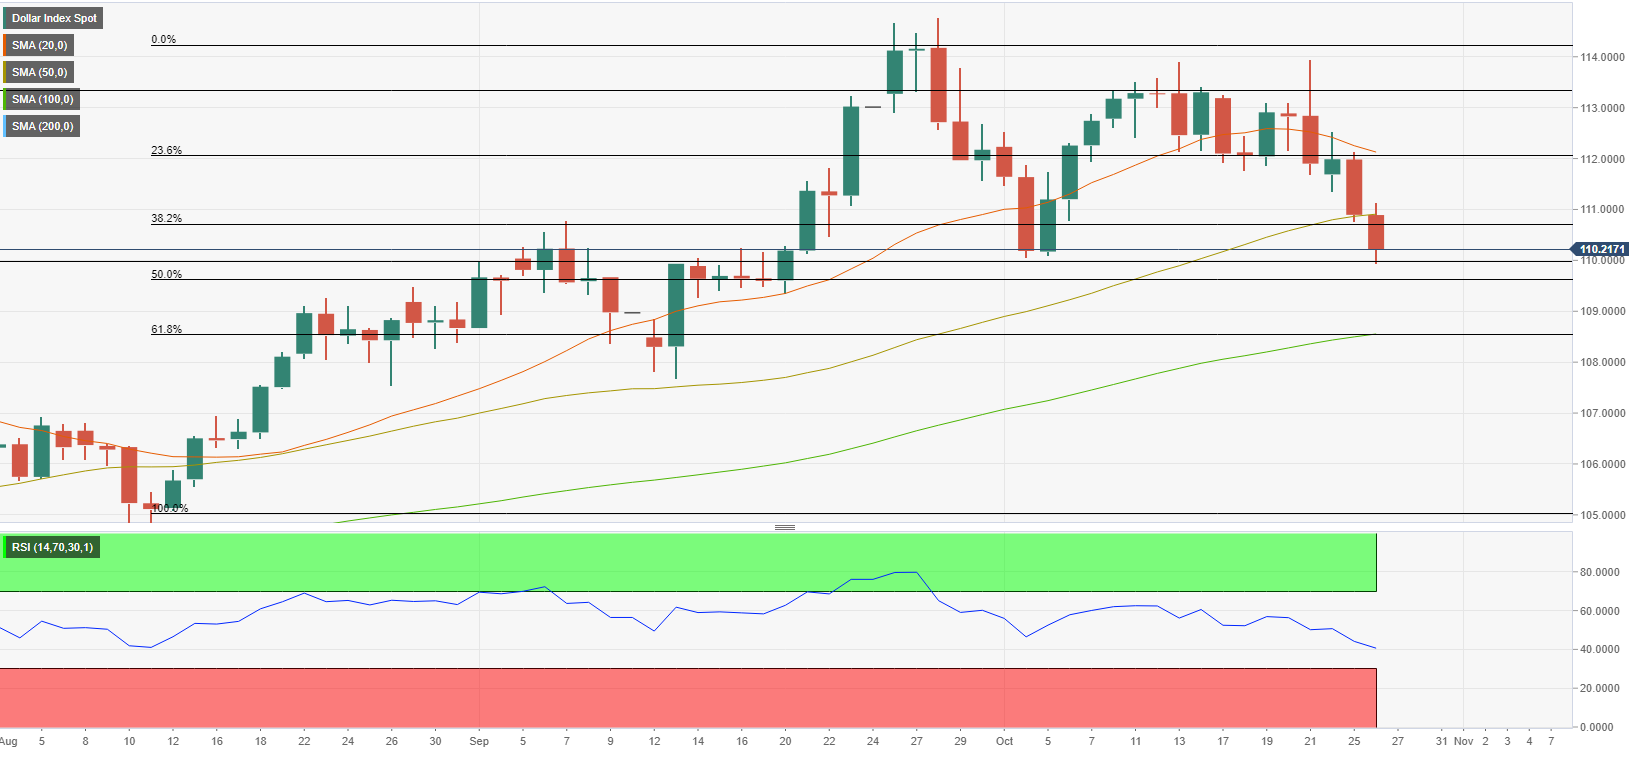
The Relative Strength Index (RSI) indicator on DXY’s daily chart declined to its lowest level since early August below 50 following the dollar sell-off witnessed in the first half of the week, pointing to a bearish tilt in the short-term outlook. On the weekly, the RSI has exited overbought, giving a sell signal. Additionally, the index broke below the 50-day SMA for the first time in over two months.
On the downside, 110.00 (psychological level) aligns as interim support. In case DXY falls below that level and starts using it as resistance, it could extend its slide toward 109.60 at around the level of a major multi-month trendline and the Fibonacci 50% retracement of the August-October uptrend. Further down still lies 108.50, the Fibonacci 61.8% retracement and the level of the 100-day SMA.
Key resistance seems to have formed at 112.00 (Fibonacci 23.6% retracement, 20-day SMA). Only a daily close above that level could be seen as a significant enough bullish development to trigger another leg higher toward 113.30 (static level) and 114.00 (end-point of the uptrend).
Premium
You have reached your limit of 3 free articles for this month.
Start your subscription and get access to all our original articles.
Author

Eren Sengezer
FXStreet
As an economist at heart, Eren Sengezer specializes in the assessment of the short-term and long-term impacts of macroeconomic data, central bank policies and political developments on financial assets.


