US Dollar's worst month since 2023: DXY faces make-or-break moment at 104.00

The greenback ends Q1 under pressure as soft inflation data, central bank divergence, and rising risk appetite weigh on the long-term outlook.
A fragile finish to Q1 for the Dollar
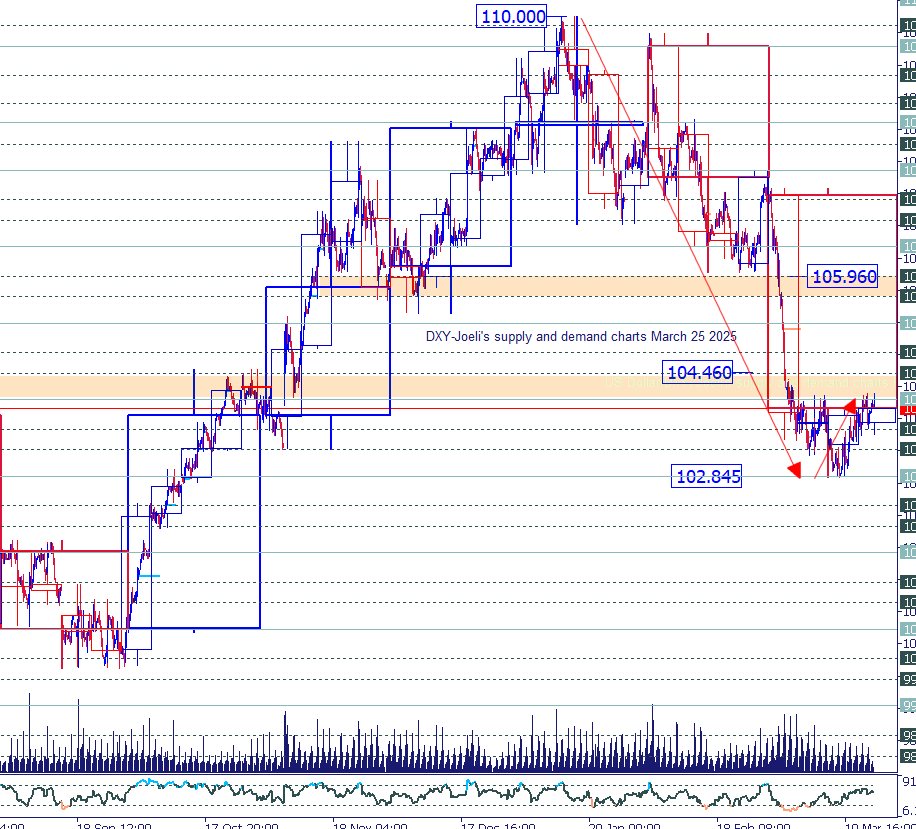
As we close out March and head into Q2, the US Dollar Index (DXY) is on track for its worst monthly performance since December 2023, erasing nearly half of its four-month rally. From a high of 110.00 in January 2025, the index has dropped to a recent low of 102.84, highlighting growing fragility in the dollar's long-term structure.
The 7.2% slide since the start of the year reflects shifting expectations around Federal Reserve policy, global interest rate convergence, and an increase in risk-on sentiment. With the DXY trading around 103.80 at the time of writing, bulls are struggling to reclaim momentum above the critical 104.00 barrier—a zone that has served as both support and resistance over the last eight months.
What's driving the weakness?
Several fundamental forces have contributed to the dollar's Q1 decline:
1. Cooling Inflation and Dovish Fed Signals
February and March inflation prints were softer than expected, leading markets to price in rate cuts sooner than the Fed's official guidance. Fed Chair Jerome Powell has maintained a cautious tone, but recent FOMC minutes and commentary from regional presidents suggest that a mid-year rate cut is increasingly likely—a development that undermines the dollar's yield advantage.
2. Global Central Bank Catch-Up
The European Central Bank (ECB) and Bank of England (BoE) have recently resisted premature rate cut expectations, with hawkish commentary supporting their respective currencies. Meanwhile, Japan's move away from ultra-loose monetary policy has lifted the yen, reducing the dollar's appeal as a carry-trade favorite.
3. Equities, Risk-On Sentiment, and Gold Strength
The S&P 500's record highs, strong demand for emerging markets, and gold's breakout to new all-time highs are clear indicators of a market rotating into risk assets and inflation hedges—further weakening safe-haven demand for the dollar.
Technical Analysis: 104.00 Is the Line in the Sand
The DXY's decline from 110.00 has retraced 50% of the four-month rally, with a firm low found at 102.84 earlier this month. While that level has provided near-term support, upside momentum remains capped below 104.00, a multi-month resistance level that must be reclaimed to reestablish bullish control.
Key Resistance Levels:
-
104.00 – Multi-month pivot zone, critical for trend shift
-
104.46 – Minor breakout level; confirmation of bullish continuation
-
105.96 – Short-term upside target if 104.46 is cleared
Key Support Zones:
-
103.58–103.25 – Minor support zone just below current levels.
-
102.84 – March low; major near-term support.
-
102.39–102.00 – Final downside target if 102.84 fails.
A break below 102.84 could accelerate bearish momentum into the 102.00 psychological level, especially if April's macro data confirms a slowing US economy or rising expectations for rate cuts.
April's outlook: All eyes on 104.00
The month of April will be pivotal in shaping the medium- to long-term outlook for the dollar. Key catalysts to watch include:
-
March jobs report (NFP) – Signs of labour market cooling will intensify rate cut bets.
-
Core PCE inflation – The Fed's preferred inflation gauge could confirm the disinflation trend.
-
Geopolitical developments – Ongoing tensions in the Red Sea, Taiwan, and Ukraine could spark temporary safe-haven flows, but may not be enough to reverse the downtrend.
Unless the DXY can close April above 104.46, it risks confirming a longer-term bearish reversal, which could open the door to sub-100 scenarios later in the year, especially if US macro data continues to soften and global rate differentials tighten further.
Scenarios to watch: Bulls need a breakout
Bullish Scenario:
-
Price holds above 103.25, reclaims 104.00, and breaks 104.46.
-
Momentum builds toward 105.96.
-
April data surprises to the upside, delaying Fed cuts.
Bearish Scenario:
-
Rejection at 104.00, breakdown below 102.84.
-
Push into 102.00 support zone or lower.
-
April macro data reinforces dovish narrative, equity strength continues.
Final thoughts: Cautious tone, technical pressure
The US dollar is ending Q1 under clear technical and fundamental pressure, with the DXY sitting at a critical inflection point. While the March low at 102.84 may hold in the short term, failure to break above 104.00–104.46 will leave the index vulnerable to further downside.
With central bank divergence fading and risk appetite on the rise, the greenback's role as a defensive play is weakening. Unless April delivers a surprise upside catalyst, the path of least resistance appears to remain lower.
Author

Denis Joeli Fatiaki
Independent Analyst
Denis Joeli Fatiaki possesses over a decade of extensive experience as a multi-asset trader and Market Strategist.


