US Dollar Weekly Forecast: Slowdown concerns and data rule the sentiment
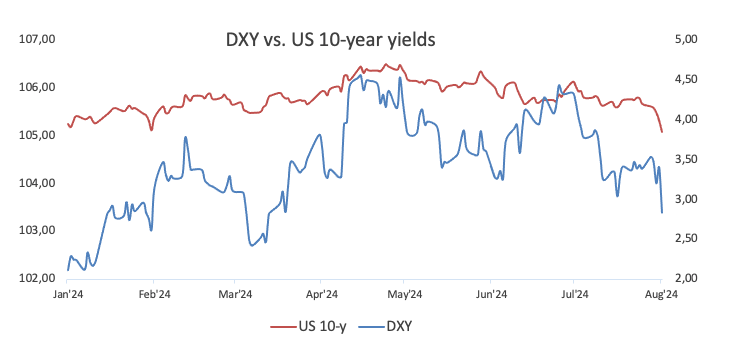
- US Dollar Index (DXY) revisited five-month lows on Friday.
- The US NFP missed estimates at 114K in July.
- Bets for a 50 bps rate cut in September gather steam.
Attention now shifts to the downside
The Greenback has traded within a bearish performance this week, with the USD Index (DXY) accelerating its decline and revisiting the 103.40 zone towards the end of the week, particularly in response to the demoralizing prints of the US labour market report for the month of July.
The price action around the US Dollar (USD) initially followed developments around the Japanese Yen, while fresh geopolitical worries and reignited concerns surrounding a potentially incipient slowdown of the US economy contributed to fresh inflows into the currency amidst broader safe haven demand in the latter half of the week.
The Fed’s divergence in monetary policy remains in place
Price action around the Greenback has been mostly focused on the Japanese Yen following past FX interventions and the unexpected rate hike by the Bank of Japan (BoJ) at its July 31 meeting.
While the Federal Open Market Committee (FOMC) gathering on July 31 reiterated that the Committee needed to see further evidence that US inflation is headed towards the bank’s 2% goal, Chief Jerome Powell suggested that an interest rate reduction in September could be considered if progress in inflation remained in place.

However, it's worth noting that speculation about a September interest rate cut has suddenly and sharply increased following the release of US inflation figures, as measured by the Consumer Price Index (CPI), which indicated a renewed disinflationary trend in June.
Additionally, inflation measured by the Personal Consumption Expenditure (PCE) showed a decline in the headline figure over the past twelve months (2.5% compared to May’s 2.6%) while remaining steady in the core reading (2.6% vs. May’s 2.6%).
Meanwhile, the European Monetary Union (EMU), Japan, Switzerland, and the United Kingdom are all facing increasing disinflationary pressures.
In response, the European Central Bank (ECB) cut rates by 25 bps in June and maintained a dovish stance in July, with policymakers hinting at the possibility of another rate cut later in the year. Additionally, the Swiss National Bank (SNB) unexpectedly cut rates by 25 bps on June 20, and the Bank of England (BoE) reduced its policy rate by a quarter-point on August 1. In contrast, the Reserve Bank of Australia (RBA) is expected to start its easing cycle at some point in Q1 2025, while the Bank of Japan (BoJ) surprised everybody after delivering a hawkish message on July 31 after hiking rates by 15 bps to 0.25%.
Rate cuts vs. a hard landing
The increasing market speculation about an earlier start to the Fed's easing cycle has been supported by the persistent decline in domestic inflation, alongside a gradual cooling in key areas such as the labour market and the manufacturing sector.
On the latter, disheartening prints from July’s Nonfarm Payrolls (+114K) now seem to have shifted investors’ attention to the probability of a half-point reduction at the September 18 gathering.
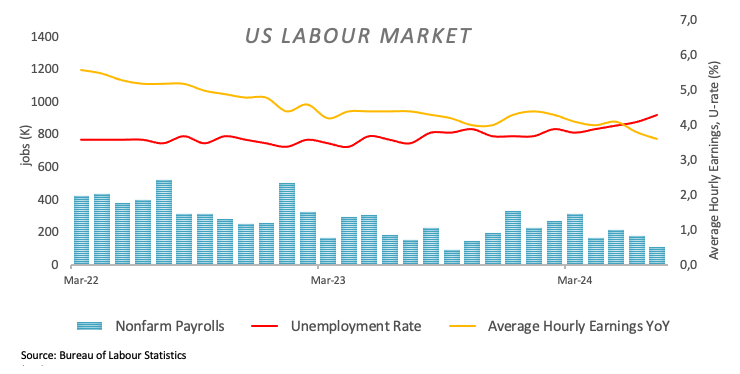
According to the FedWatch Tool by CME Group, a 25 bps interest rate cut at the September 18 meeting hovers around 32% vs. nearly 68% of chances of a 50 bps reduction.
It is worth recalling that at the Fed’s latest event on July 31, Chair Powell emphasized the need for greater confidence in controlling inflation, citing Q2 inflation readings as supportive evidence. He noted that the bank is moving closer to a potential rate cut. Powell mentioned that if inflation continues to decrease, economic growth remains strong, and the labor market remains stable, a rate cut could be considered, possibly in September.
The Greenback reacted negatively to Powell’s dovish tilt, but concerns about a potential slowdown in US economic activity lent support to the currency later in the week. This was driven by a larger-than-expected increase in weekly Jobless Claims and an additional contraction in the ISM Manufacturing PMI, all contributing to rising inflows into safe-haven assets.
However, in the longer term, the increasing likelihood of another Trump administration and the potential reintroduction of tariffs could disrupt or even reverse the current disinflationary trend in the US economy, potentially shortening the Federal Reserve's easing cycle.
US yields maintain their negative trend
The performance of the US money market demonstrated an accelerated downward trend in yields across various time frames over the past week. That said, benchmark 10-year yields fell below the 4.0% mark for the first time since early February, while the short end retreated to levels last seen in mid-May 2023, near 4.10%.
Upcoming key events
The US service sector will be at the center of the debate next week on a pretty light US calendar. Against that, the final S&P Global Services PMI will come first, followed by the more significant ISM Services PMI, while the Fed’s rate setters, Mary Daly and Thomas Barkin, will kick off the monthly round of Fed speakers.
Techs on the US Dollar Index
The DXY broke below the key 200-day SMA around 104.30 with certain conviction, paving the way for the continuation of the downtrend, at least in the near term. While below this key region, the outlook for the Greenack is predicted to remain bearish.
If bears regain the initiative, the US Dollar Index (DXY) might initially drop to its weekly/monthly low of 103.38 (August 2), ahead of the March low of 102.35 (March 8). Further south, the December low of 100.61 (December 28) comes before the psychological barrier of 100.00.
On the flip side, DXY confronts immediate resistance at the weekly high of 104.79 (July 30), which appears propped up by the temporary barriers at the 100-day and 55-day SMAs at 104.83 and 104.90, respectively. Once this region is cleared, DXY could embark on a probable advance to the June top of 106.13 (June 26), ahead of the 2024 peak of 106.51 (April 16).

US Dollar PRICE Today
The table below shows the percentage change of US Dollar (USD) against listed major currencies today. US Dollar was the strongest against the Canadian Dollar.
| USD | EUR | GBP | JPY | CAD | AUD | NZD | CHF | |
|---|---|---|---|---|---|---|---|---|
| USD | -0.92% | -0.63% | -1.40% | -0.22% | -0.48% | -0.44% | -1.00% | |
| EUR | 0.92% | 0.28% | -0.39% | 0.69% | 0.43% | 0.47% | -0.08% | |
| GBP | 0.63% | -0.28% | -0.70% | 0.42% | 0.14% | 0.20% | -0.34% | |
| JPY | 1.40% | 0.39% | 0.70% | 1.13% | 0.84% | 0.88% | 0.34% | |
| CAD | 0.22% | -0.69% | -0.42% | -1.13% | -0.27% | -0.21% | -0.76% | |
| AUD | 0.48% | -0.43% | -0.14% | -0.84% | 0.27% | 0.05% | -0.50% | |
| NZD | 0.44% | -0.47% | -0.20% | -0.88% | 0.21% | -0.05% | -0.53% | |
| CHF | 1.00% | 0.08% | 0.34% | -0.34% | 0.76% | 0.50% | 0.53% |
The heat map shows percentage changes of major currencies against each other. The base currency is picked from the left column, while the quote currency is picked from the top row. For example, if you pick the US Dollar from the left column and move along the horizontal line to the Japanese Yen, the percentage change displayed in the box will represent USD (base)/JPY (quote).
Premium
You have reached your limit of 3 free articles for this month.
Start your subscription and get access to all our original articles.
Author

Pablo Piovano
FXStreet
Born and bred in Argentina, Pablo has been carrying on with his passion for FX markets and trading since his first college years.


