USD/CHF Elliott Wave technical analysis [Video]
![USD/CHF Elliott Wave technical analysis [Video]](https://editorial.fxstreet.com/images/Markets/Currencies/Majors/USDCHF/swiss-money-with-coins-ii-2022332_XtraLarge.jpg)
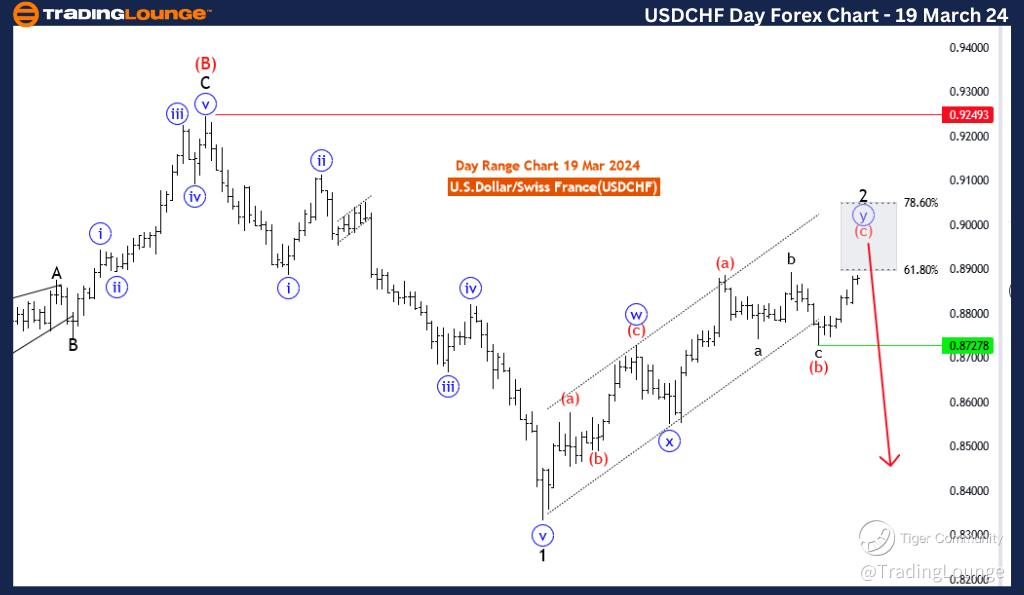
USD/CHF Elliott Wave Analysis Trading Lounge Day Chart, 19 March 24.
U.S.Dollar/Swiss Franc(USD/CHF) Day Chart.
USD/CHF Elliott Wave technical analysis
Function: Counter Trend.
Mode: Corrective.
Structure: Red wave C.
Position: Blue wave Y of 2.
Direction next lower degrees: Black wave 3
Details: Red wave C of Y of 2 is in play and likely to end between fib level 60.80 to 78.60 .. Wave Cancel invalid level:
The USD/CHF Elliott Wave Analysis for the day chart on 19 March 24, provides insights into the potential price movements of the U.S. Dollar/Swiss Franc currency pair based on Elliott Wave principles within technical analysis.
Identified as a "Counter Trend" scenario, the analysis suggests a deviation from the prevailing trend, indicating a potential corrective phase in the market. This indicates that the current price movement is against the predominant trend direction.
Described as "Corrective" in mode, the analysis implies that the current price action is part of a corrective wave within the broader Elliott Wave structure. This suggests that the market is experiencing a temporary reversal or retracement within the context of a larger trend.
The "STRUCTURE" is labeled as "red wave C," indicating that the market is currently undergoing a corrective phase within the larger Elliott Wave count. This suggests that the current price movement is part of a corrective wave within a broader Elliott Wave cycle.
Positioned as "blue wave Y of 2," the analysis indicates that the current corrective phase is part of a higher-degree Elliott Wave cycle. This implies that the corrective movement is occurring within the context of a larger corrective structure.
The "DIRECTION NEXT LOWER DEGREES" is identified as "black wave 3," suggesting the expected direction for the subsequent lower-degree wave. This indicates that once the current corrective phase completes, the market may resume its downward movement in the lower-degree Elliott Wave cycle.
In the "DETAILS" section, it is mentioned that "red wave C of Y of 2 is in play and likely to end between the Fibonacci levels of 60.80 to 78.60." This suggests that the current corrective phase is expected to conclude within a specific Fibonacci retracement zone.
The "Wave Cancel invalid level" is specified as 0.92493, serving as a critical threshold. A breach beyond this level would invalidate the current wave count, necessitating a reassessment of the analysis.
In summary, the USD/CHF Elliott Wave Analysis for the day chart on 19 March 24, suggests a counter-trend corrective scenario, providing insights into potential price movements and key levels to monitor for potential trend reversals.0.92493.
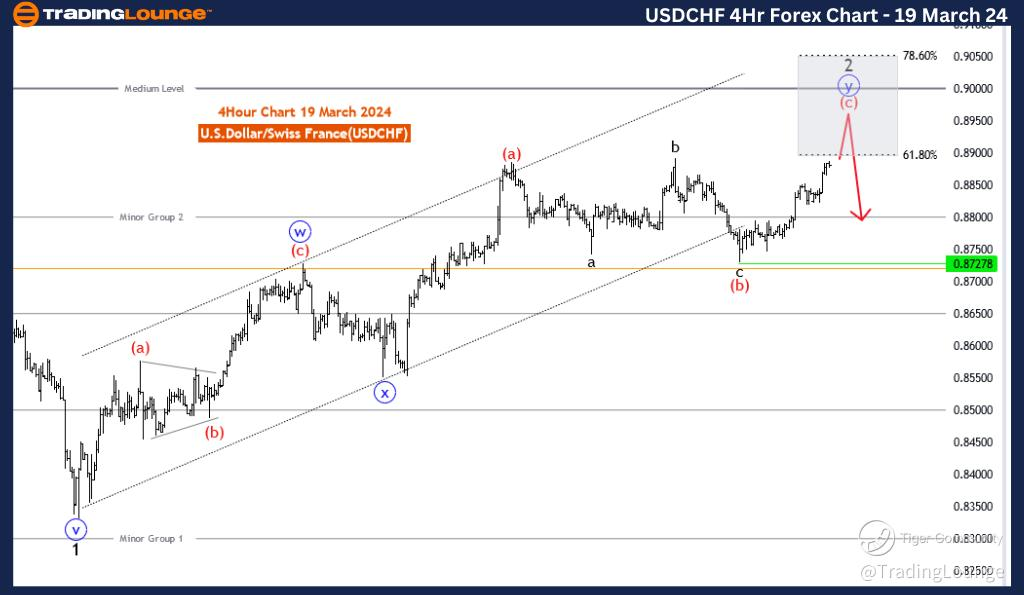
USD/CHF Elliott Wave Analysis Trading Lounge 4 Hour Chart, 19 March 24.
U.S.Dollar/Swiss Franc(USD/CHF) 4 Hour Chart.
USD/CHF Elliott Wave technical analysis
Function: Counter Trend.
Mode: Corrective.
Structure: Red wave C.
Position: blue wave Y of 2.
Direction next lower degrees: Black wave 3.
Derails: Red wave C of Y of 2 is in play and likely to end between fib level 60.80 to 78.60 .. Wave Cancel invalid level: 0.92493
The USD/CHF Elliott Wave Analysis for the 4-hour chart on 19 March 24, offers insights into the potential price movements of the U.S. Dollar/Swiss Franc currency pair based on Elliott Wave principles within technical analysis.
Identified as a "Counter Trend" scenario, the analysis suggests a deviation from the prevailing trend, indicating a potential corrective phase in the market.
Described as "Corrective" in mode, the analysis indicates that the current price action is likely part of a corrective wave within the broader Elliott Wave structure.
The "STRUCTURE" is labeled as "red wave C," implying that the market is currently experiencing a corrective phase within the larger Elliott Wave count.
Positioned as "blue wave Y of 2," the analysis suggests that the current price movement is part of a corrective wave within a higher-degree Elliott Wave cycle. This implies that the corrective phase is occurring within the context of a larger corrective structure.
The "DIRECTION NEXT LOWER DEGREES" is identified as "black wave 3," indicating the expected direction for the subsequent lower-degree wave. This suggests that once the current corrective phase completes, the market may resume its downward movement.
In the "DETAILS" section, it is mentioned that "red wave C of Y of 2 is in play and likely to end between fib level 60.80 to 78.60." This suggests that the current corrective phase is expected to conclude within a specific Fibonacci retracement zone.
The "Wave Cancel invalid level" is specified as 0.92493, serving as a critical threshold. A breach beyond this level would invalidate the current wave count, necessitating a reassessment of the analysis.
In summary, the USD/CHF Elliott Wave Analysis for the 4-hour chart on 19 March 24, suggests a counter-trend scenario characterized by corrective movements. The analysis provides insights into the potential completion of the current corrective phase and identifies key levels for monitoring potential shifts in the wave count and trend dynamics.
Technical analyst: Malik Awais.
USD/CHF Elliott Wave technical analysis [Video]
Author

Peter Mathers
TradingLounge
Peter Mathers started actively trading in 1982. He began his career at Hoei and Shoin, a Japanese futures trading company.


