Since the US Dollar trades freely in the 1970s, on average it has rallied and declined in a period of 7.5 years. The chart below shows short term and long term US Dollar cycle:

Short Term and Long Term US Dollar Cycle

Elliottwave Forecast

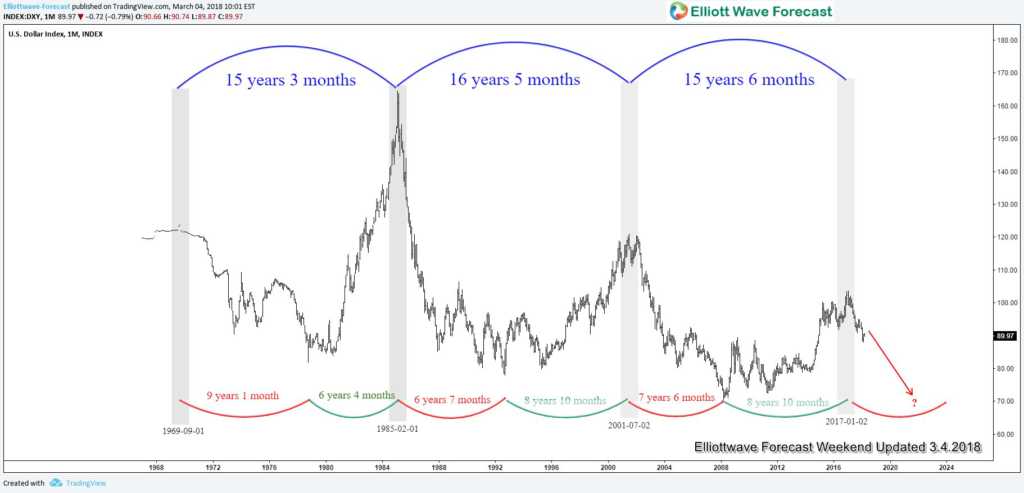
From the chart above, we can see that since 1970s, the cycle in US Dollar from peak to peak (blue color) is about 15 years on average. The 15 year peak-to-peak cycle is subdivided into 2 sub-cycles: USD weakness period (peak to trough) in red color, and USD strength period (trough to the peak), in green color. Each sub-cycle lasts roughly 7.5 years on average.

US Dollar currently appears to have ended the last peak on January 2017. The previous cycle in USD strength (green color) lasted from September 1992 – July 2001 for a period of 8 years 10 months. The latest cycle in USD strength (green color) lasted from March 2008 to January 2017, which is the same 8 years 10 months up-cycle compared to the previous one. The peak-to-peak cycle has also reached the average of 15 years.

If this cycle is going to repeat, then US Dollar appears to continue to get weak in red cycle (downtrend) from year 2017 to 2024 – 2025 before it starts a 7 year up cycle (green color) from year 2024 to 2031. What leads to the trend change in USD is a combination of valuation, current account dynamic, and the Central Bank Action like the chart below from Nomura shows:
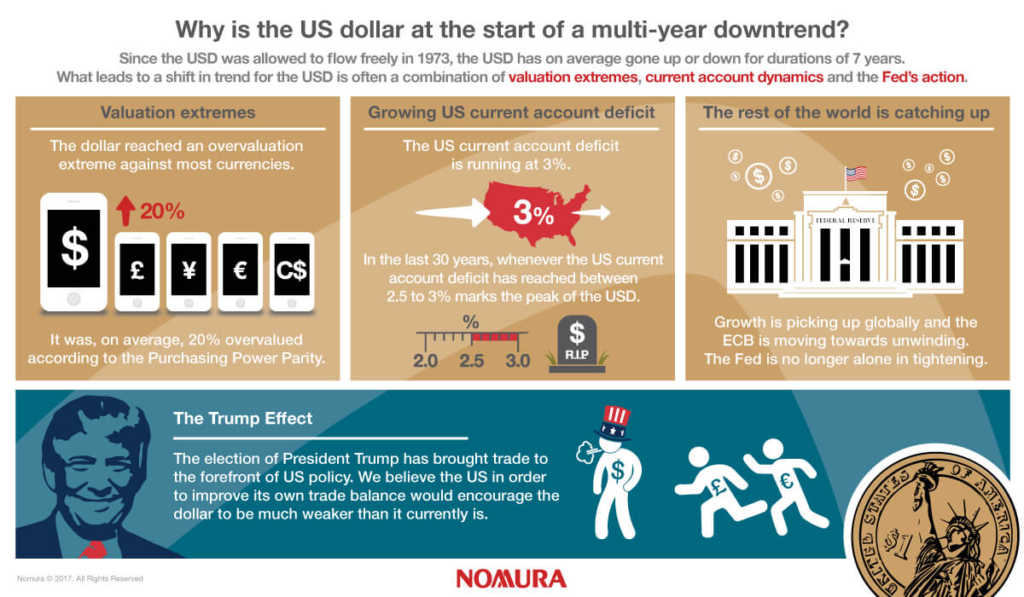
Elliottwave Forecast

Overvaluation

Based on the Purchasing Power Parity, US Dollar on average is 20% overvalued against other major currencies, including Yen, Euro, Pound, and Canadian Dollar. Valuation extremes usually suggest the US Dollar has gone too much and we have started to see the reversal lately and likely will continue to see it in the next few years.

Growing Account Deficit

The US current account deficit now is running at 3%. Current account is the total export value of the goods and services minus the total imports. In the last 30 years, when the US account deficit reaches extreme levels between 2.5 – 3%, the Dollar is close to reversal. The last time US Dollar reached multi-year peak at 1985 and 2001, the US also had a current account deficit of 2.5 – 3%.

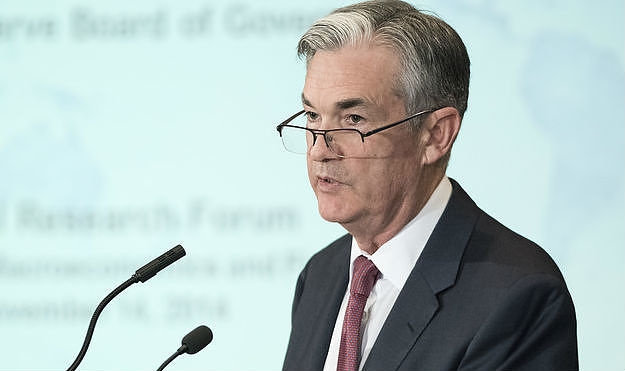
Central Bank’s Action

In the past, we saw a divergence in the monetary policy and interest rate between the Fed and other central banks, causing US Dollar’s strength. For example, the Fed started tapering in 2013 and hiked the interest rate in 2015, whereas other central banks were still loosening policy. This divergence caused US Dollar to soar and appreciate against other major currencies.

However, global recovery caused other central banks to also unwind the loose monetary policy. The Bank of Canada has started to hike rate. ECB and BOJ have started to taper bond’s buying. This removes one major support for USD and makes the dollar vulnerable even if the Fed continues to hike further.


Become a Successful Trader and Master Elliott Wave like a Pro. Start your Free 14 Day Trial at - Elliott Wave Forecast.

FURTHER DISCLOSURES AND DISCLAIMER CONCERNING RISK, RESPONSIBILITY AND LIABILITY Trading in the Foreign Exchange market is a challenging opportunity where above average returns are available for educated and experienced investors who are willing to take above average risk. However, before deciding to participate in Foreign Exchange (FX) trading, you should carefully consider your investment objectives, level of xperience and risk appetite. Do not invest or trade capital you cannot afford to lose. EME PROCESSING AND CONSULTING, LLC, THEIR REPRESENTATIVES, AND ANYONE WORKING FOR OR WITHIN WWW.ELLIOTTWAVE- FORECAST.COM is not responsible for any loss from any form of distributed advice, signal, analysis, or content. Again, we fully DISCLOSE to the Subscriber base that the Service as a whole, the individual Parties, Representatives, or owners shall not be liable to any and all Subscribers for any losses or damages as a result of any action taken by the Subscriber from any trade idea or signal posted on the website(s) distributed through any form of social-media, email, the website, and/or any other electronic, written, verbal, or future form of communication . All analysis, trading signals, trading recommendations, all charts, communicated interpretations of the wave counts, and all content from any media form produced by www.Elliottwave-forecast.com and/or the Representatives are solely the opinions and best efforts of the respective author(s). In general Forex instruments are highly leveraged, and traders can lose some or all of their initial margin funds. All content provided by www.Elliottwave-forecast.com is expressed in good faith and is intended to help Subscribers succeed in the marketplace, but it is never guaranteed. There is no “holy grail” to trading or forecasting the market and we are wrong sometimes like everyone else. Please understand and accept the risk involved when making any trading and/or investment decision. UNDERSTAND that all the content we provide is protected through copyright of EME PROCESSING AND CONSULTING, LLC. It is illegal to disseminate in any form of communication any part or all of our proprietary information without specific authorization. UNDERSTAND that you also agree to not allow persons that are not PAID SUBSCRIBERS to view any of the content not released publicly. IF YOU ARE FOUND TO BE IN VIOLATION OF THESE RESTRICTIONS you or your firm (as the Subscriber) will be charged fully with no discount for one year subscription to our Premium Plus Plan at $1,799.88 for EACH person or firm who received any of our content illegally through the respected intermediary’s (Subscriber in violation of terms) channel(s) of communication.

Recommended Content


Recommended Content

Editors’ Picks

AUD/USD: The hunt for the 0.7000 hurdle

AUD/USD: The hunt for the 0.7000 hurdle

AUD/USD quickly left behind Wednesday’s strong pullback and rose markedly past the 0.6900 barrier on Thursday, boosted by news of fresh stimulus in China as well as renewed weakness in the US Dollar.

AUD/USD News
EUR/USD refocuses its attention to 1.1200 and above

EUR/USD refocuses its attention to 1.1200 and above

Rising appetite for the risk-associated assets, the offered stance in the Greenback and Chinese stimulus all contributed to the resurgence of the upside momentum in EUR/USD, which managed to retest the 1.1190 zone on Thursday.

EUR/USD News
Gold holding at higher ground at around $2,670

Gold holding at higher ground at around $2,670

Gold breaks to new high of $2,673 on Thursday. Falling interest rates globally, intensifying geopolitical conflicts and heightened Fed easing bets are the main factors. 

Gold News
Bitcoin displays bullish signals amid supportive macroeconomic developments and growing institutional demand

Bitcoin displays bullish signals amid supportive macroeconomic developments and growing institutional demand

Bitcoin (BTC) trades slightly up, around $64,000 on Thursday, following a rejection from the upper consolidation level of $64,700 the previous day. BTC’s price has been consolidating between $62,000 and $64,700 for the past week.

Read more
RBA widely expected to keep key interest rate unchanged amid persisting price pressures

RBA widely expected to keep key interest rate unchanged amid persisting price pressures

The Reserve Bank of Australia is likely to continue bucking the trend adopted by major central banks of the dovish policy pivot, opting to maintain the policy for the seventh consecutive meeting on Tuesday.

Read more
Five best Forex brokers in 2024

Five best Forex brokers in 2024

VERIFIED Choosing the best Forex broker in 2024 requires careful consideration of certain essential factors. With the wide array of options available, it is crucial to find a broker that aligns with your trading style, experience level, and financial goals. 

Read More

Majors

Cryptocurrencies

Signatures