Upswing short-lived [Video]
![Upswing short-lived [Video]](https://editorial.fxstreet.com/images/Markets/Currencies/Majors/DollarIndex/us-currency-2848629_XtraLarge.jpg)
US Dollar: Dec '22 USD is Down at 104.735.
Energies: Jan '23 Crude is Down at 70.41.
Financials: The Mar '23 30 Year T-Bond is Up 19 ticks and trading at 130.16.
Indices: The Dec '22 S&P 500 emini ES contract is 43 ticks Higher and trading at 3947.00.
Gold: The Feb'23 Gold contract is trading Down at 1803.50. Gold is 70 ticks Lower than its close.
Initial conclusion
This is not a correlated market. The dollar is Down, and Crude is Down which is not normal, and the 30 Year T-Bond is trading Higher. The Financials should always correlate with the US dollar such that if the dollar is lower, then the bonds should follow and vice-versa. The S&P is Higher, and Crude is trading Lower which is correlated. Gold is trading Lower which is not correlated with the US dollar trading Down. I tend to believe that Gold has an inverse relationship with the US Dollar as when the US Dollar is down, Gold tends to rise in value and vice-versa. Think of it as a seesaw, when one is up the other should be down. I point this out to you to make you aware that when we don't have a correlated market, it means something is wrong. As traders you need to be aware of this and proceed with your eyes wide open. Currently all of Asia is trading Lower. Currently all of Europe is trading Lower as well with the exception of the Milan Exchange which is Higher.
Possible challenges to traders today
-
10-y Bond Auction starts at 1 PM EST. This is Major.
-
Federal Budget Balance is out at 2 PM EST. This is Major.
-
Lack of Major Economic news.
Treasuries
Traders, please note that we've changed the Bond instrument from the 30 year (ZB) to the 10 year (ZN). They work exactly the same.
We've elected to switch gears a bit and show correlation between the 10-year bond (ZN) and the S&P futures contract. The S&P contract is the Standard and Poor's, and the purpose is to show reverse correlation between the two instruments. Remember it's likened to a seesaw, when up goes up the other should go down and vice versa.
On Friday the Bonds hit a High at around 8:30 AM EST. The S&P hit a Low at around that time and the Bonds moved Lower shortly thereafter. If you look at the charts below ZN gave a signal at around 8:30 AM and the S&P gave a signal at around the same time. Look at the charts below and you'll see a pattern for both assets. ZN hit a High at around 8:30 AM and the S&P moved Higher shortly thereafter. These charts represent the newest version of MultiCharts and I've changed the timeframe to a 15-minute chart to display better. This represented a Short opportunity on the 10-year note, as a trader you could have netted about 20 ticks per contract on this trade. Each tick is worth $15.625. Please note: the front month for the ZN is now Dec '22. The S&P contract is also Dec' 22. I've changed the format to Renko Bars such that it may be more apparent and visible.
Charts courtesy of MultiCharts built on an AMP platform
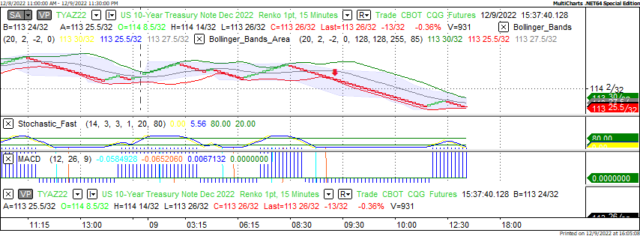
ZN - Dec 2022 - 12/09/22
-638064439900158549.png)
S&P - Dec 2022 - 12/09/22
Bias
On Friday we gave the markets an Upside bias as the Bonds and the USD were trading Lower and this usually represents an Upside Day. The markets however had other ideas as the Dow dropped 305 points and the other indices lost ground as well. Today we aren't dealing with a correlated market and our bias is to the Upside.
Could this change? Of Course. Remember anything can happen in a volatile market.
Commentary
On Friday we opted for an Upside Day as the indices were correlated in that direction. Most of the morning the Dow was trading Higher but by 2 PM EST in the afternoon it was evident that the markets were headed Lower, and they did. What caused this? We think lack of follow thru and commitment from the Smart Money. Remember they can move the markets in any direction they choose as they have the capital and "horsepower" to do so. Today we have a 10-year bond auction starting at 1 PM EST this afternoon and the Federal Budget Balance at 2 PM EST. Will this be enough to move the markets? Only time will tell.
Author

Nick Mastrandrea
Market Tea Leaves


