Up again and again [Video]
![Up again and again [Video]](https://editorial.fxstreet.com/images/Markets/Currencies/Majors/DollarIndex/american-economy-growth-20334575_XtraLarge.jpg)
US Dollar: Dec '22 USD is Up at 111.960.
Energies: Dec '22 Crude is Down at 83.48.
Financials: The Dec '22 30 Year note is Down 20 ticks and trading at 118.30.
Indices: The Dec '22 S&P 500 emini ES contract is 51 ticks Lower and trading at 3796.50.
Gold: The Dec'22 Gold contract is trading Down at 1643.00. Gold is 111 ticks Lower than its close.
Initial conclusion
This is a nearly correlated market. The dollar is Up, and Crude is Down which is normal, and the 30-year Bond is trading Higher. The Financials should always correlate with the US dollar such that if the dollar is lower, then the bonds should follow and vice-versa. The S&P is Lower, and Crude is trading Lower which is not correlated. Gold is trading Lower which is correlated with the US dollar trading Up. I tend to believe that Gold has an inverse relationship with the US Dollar as when the US Dollar is down, Gold tends to rise in value and vice-versa. Think of it as a seesaw, when one is up the other should be down. I point this out to you to make you aware that when we don't have a correlated market, it means something is wrong. As traders you need to be aware of this and proceed with your eyes wide open. Currently Asia is trading Mixed with half the exchanges Higher and the other half Lower. Europe is trading Mixed as well.
Possible challenges to traders today
-
HPI is out at 9 AM EST. This is Major.
-
S&P/CS Composite-20 HPI is out at 9 AM EST. This is Major.
-
CB Consumer Confidence is out at 10 AM EST. This is Major.
-
Richmond Manufacturing Index is out at 10 AM EST. Major.
-
FOMC Member Waller Speaks at 1:55 PM EST. Major.
Treasuries
Traders, please note that we've changed the Bond instrument from the 30 year (ZB) to the 10 year (ZN). They work exactly the same.
We've elected to switch gears a bit and show correlation between the 10-year bond (ZN) and the S&P futures contract. The S&P contract is the Standard and Poor's, and the purpose is to show reverse correlation between the two instruments. Remember it's likened to a seesaw, when up goes up the other should go down and vice versa.
Yesterday the ZN made its move at around 9:45 AM EST. The ZN hit a Low at around that time and the S&P moved Lower shortly thereafter. If you look at the charts below ZN gave a signal at around 9:45 AM and the S&P gave a signal at around the same time. Look at the charts below and you'll see a pattern for both assets. ZN hit a Low at around 9:45 AM and the S&P moved Lower shortly thereafter. These charts represent the newest version of MultiCharts and I've changed the timeframe to a 15-minute chart to display better. This represented a Long opportunity on the 10-year note, as a trader you could have netted about 20 plus ticks per contract on this trade. Each tick is worth $15.625. Please note: the front month for the ZN is now Dec '22. The S&P contract is also Dec' 22. I've changed the format to Renko Bars such that it may be more apparent and visible.
Charts courtesy of MultiCharts built on an AMP platform
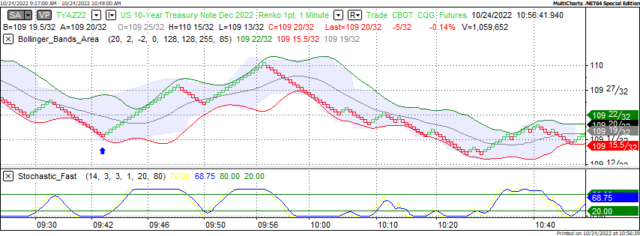
ZN - Dec 2022 - 10/24/22
-638022947717345009.png)
S&P - Dec 2022 - 10/24/22
Bias
Yesterday we gave the markets a Downside bias as both the USD and the Bonds were trading Higher Monday morning. This usually represents a Down Day for the indices however the markets had other ideas as the Dow traded Higher by 417 points and the other indices traded Higher as well. Today we are dealing with a nearly correlated market, and it's correlated to the Downside.
Could this change? Of Course. Remember anything can happen in a volatile market.
Commentary
Well yesterday proved to be a surprise as the thought yesterday was the markets had gone Higher by 700 plus points and the mindset was "it will go down". Surprisingly it didn't, it went Higher. The proof that it would go Lower came as both the USD and the Bonds were trading Higher Monday and that usually means a Downside Day. But as we always say every day "this can change" and yesterday it did. What do we think happened? We think the Smart Money wanted to boost the markets Higher and did so. Do we think that they are done? Only time will tell that.
Author

Nick Mastrandrea
Market Tea Leaves


