GBP, “Green”land: UK, you ok?

UK, you ok?
First up, I guess my panic to send out the bullish USDCAD idea yesterday was misguided. USDCAD is sharply unchanged over the past 24 hours despite quite a lot of interest in topside USDCAD. Meanwhile, the UK is in the spotlight ...
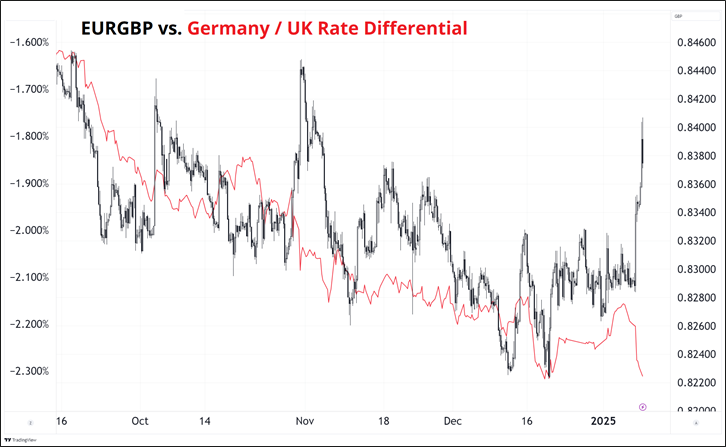
It is not hard to see the regime shift there in the last few days as the gilt market has been clobbered (higher UK yields = lower red line) and the pound has also been taken behind the woodshed (lower GBP = higher EURGBP black candles). Liz Truss’ name is being used in vain as we flash back to the Kwarteng mini-budget of 2022.
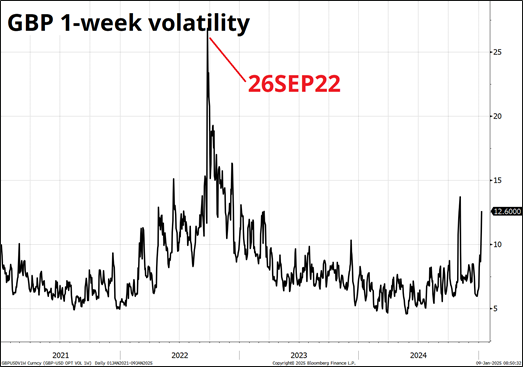
These moves tend to feed on themselves and continue until you get a blowoff and/or government intervention. We are not there yet. For perspective, here's 1-week GBPUSD volatility since 2021.
The monster levels are 0.8440 in EURGBP and 1.2020/50 in GBPUSD.
Some weirdness
Stocks trade poorly, the quantum computing bubble has burst, Chinese equities are near the post-stimmy lows, the USD is bid, and copper is… Ripping higher? That’s odd. I honestly don’t know what to make of it, but I mention it as something for you to noodle. I can’t think of a single reason to buy AUDUSD here from a macro perspective, but the divergence with copper and the presence of the huge multi-year support here is intriguing. Chinese yields are also off the 2025 lows, but just barely.
Let me fire up four charts here and you can decide for yourself what they mean, since I don’t know.
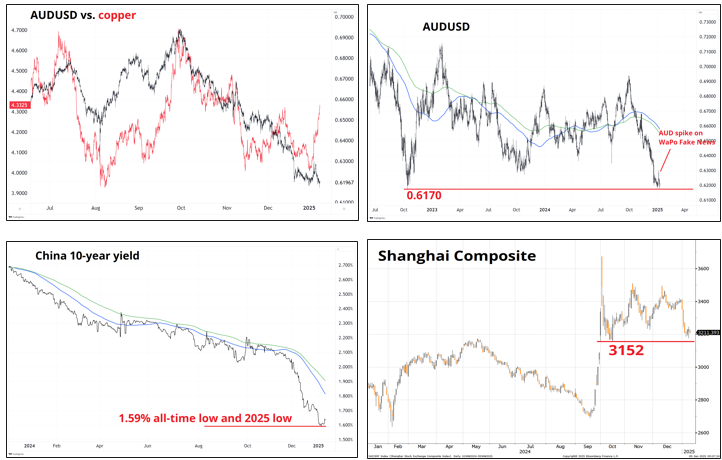
If we didn’t have to worry about reliving Smoot-Hawley in two weeks, we could probably make a decent argument for long AUDUSD here. But we do, so I can’t.
Greenland is ice and Iceland is green
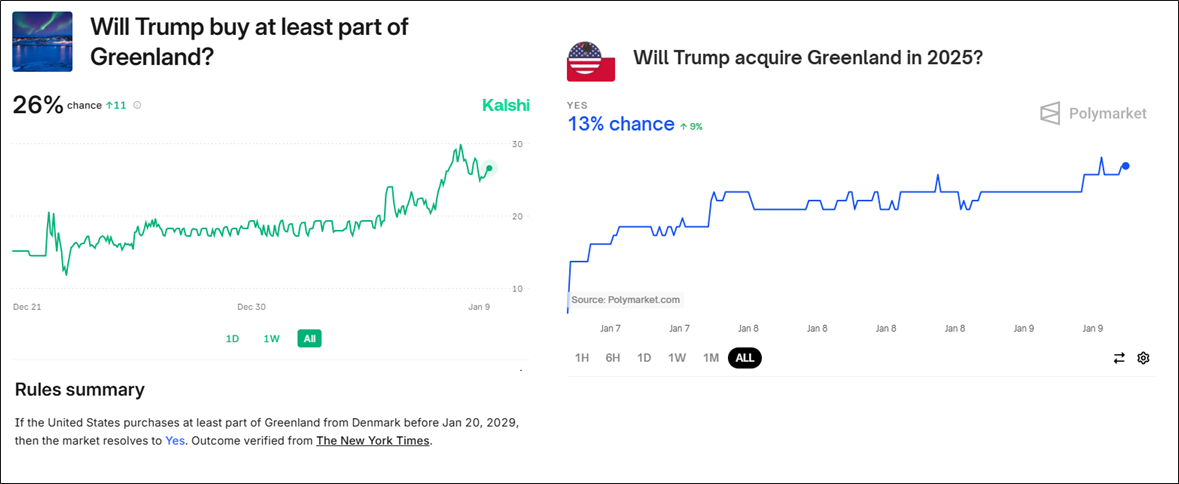
I made a snarky comment like “Trump buying Greenland HAHA” yesterday, and a reader politely informed me that I may be a bit too cynical on the topic. Upon further review, I think he is right. After studying the issue a bit more, it does seem like there is a non-zero chance of some sort of strategic USA/Greenland deal. In fact, the tradable odds are as follows:
This bugs me, but we also park on driveways and drive on parkways, so…
H2 trade ideas recap
Today is my trade ideas recap for H2 2024. On October 24th, 2017, I wrote the following after reading Philip Tetlock’s excellent book Superforecasting:
One of Tetlock’s big beefs, which is a pet peeve of mine too, is the litany of forecasts that stream daily on CNBC, Bloomberg and the internet without any scrutiny or follow-up. Specifically, the relentless stream of “Crash Imminent” predictions is a complete joke. These inaccurate, one-way forecasters are not called out, they are instead deified as “the famed economist who correctly predicted the collapse of 2000 and 2008” etc.
Most analysts that get credit like this predict a crash every year or two and then claim credit in the very few years their call is right. There is no verification (and many forecasts are so open-ended they are impossible to verify) so anyone can make any prediction and it is more important how famous they are, not how accurate they are. I don’t mean to pick on a specific website or forecaster—As an industry, Wall Street is simply terrible at following up on the flood of forecasts we make every day.
It is pretty weird how we don’t even have much data on who is good at forecasting the main US economic data, when this is easily verifiable with a bit of work. Anyone know the Brier Score of the top 10 forecasters of US economic data? Is their forecasting skill persistent? There are many reasons not to follow up on forecasts but most of them suit the forecaster not the users of the forecast.
For example, people sometimes ask me to publish my trade idea outcomes. I hesitate for four reasons:
-
If I am right a lot in AM/FX but my real-world P&L isn’t that great, it looks bad and feels bad. “Great calls, Brent, but what’s with your teeny little P&L?”
-
If I am wrong a lot, I look stupid. My credibility could be damaged.
-
If I am right a lot, it looks like I am bragging. Victory laps are annoying.
The purpose of AM/FX is not necessarily to publish ideas which readers blindly follow. My goal is to help you make your own investment and trading decisions. The idea is to reveal my process and put stuff on your radar. Hopefully that helps you improve your process and plants the seed for some good trades on your end.
The thing is, though, after reading Superforecasting I feel it’s lame and disingenuous to make forecasts and then not follow up. So, I will collect and publish my trade idea results. Caveats: My real-world trading P&L can differ dramatically from the P&L of the “Current Views”. Also: I cannot guarantee the accuracy of the data (though I present it, in full, on the next page and I’m pretty sure it’s accurate). Past performance does not guarantee future results. Ask your doctor if AM/FX is right for you.
Next, you will find a detailed sheet that shows my trade ideas since the last update (which was in am/FX on July 11, 2024). In order for the trades to be comparable, I assume a portfolio with a $4m stop loss that risks $100,000 on each trade (2.5% of free capital).
The $ amounts are not the point; the point is just to normalize the trades because reporting % returns on trades makes no sense. What makes sense is to normalize risk based on how wide the stop loss is. Tighter stops = bigger positions and vice versa. So, to be clear: I risk $100,000 on each trade, backing out the position size from the difference between the entry point and the stop loss. This is all fully explained in Chapter 11 of Alpha Trader. The main point of this results exercise is: transparency and accountability.
Author

Brent Donnelly
Spectra Markets
Brent Donnelly is the President of Spectra Markets. He has been trading currencies since 1995 and writing about macro since 2004. Brent is the author of “Alpha Trader” (2021) and “The Art of Currency Trading” (Wiley, 2019).


