Trump circus deflates markets
US Dollar: Jun '23 USD is Up at 101.385
Energies: May '23 Crude is Down at 80.49.
Financials: The Jun '23 30 Year T-Bond is Down 9 ticks and trading at 132.27.
Indices: The Jun '23 S&P 500 Emini ES contract is 36 ticks Lower and trading at 4120.00.
Gold: The Apr'23 Gold contract is trading Up at 2039.00. Gold is 8 ticks Higher than its close.
Initial conclusion
This is not a correlated market. The USD is Up, and Crude is Down which is normal, but the 30 Year T-Bond is trading Lower. The Financials should always correlate with the US dollar such that if the dollar is Higher, then the bonds should follow and vice-versa. The S&P is Lower, and Crude is trading Lower which is not correlated. Gold is trading Higher which is not correlated with the US dollar trading Up. I tend to believe that Gold has an inverse relationship with the US Dollar as when the US Dollar is down, Gold tends to rise in value and vice-versa. Think of it as a seesaw, when one is up the other should be down. I point this out to you to make you aware that when we don't have a correlated market, it means something is wrong. As traders you need to be aware of this and proceed with your eyes wide open. At the present time Asia is trading Mixed with half the exchanges Higher and the other half Lower. Currently Europe is trading mainly Lower with only the London and Spanish Ibex Higher. .
Possible challenges to traders today
-
ADP Non-Farm Employment Change is out at 8:15 AM EST. This is Major.
-
Trade Balance is out at 8:30 AM EST. This is Major.
-
Final Services PMI is out at 9:45 AM EST. This is Major.
-
ISM Services PMI is out at 10 AM EST. This is Major.
-
Crude Oil Inventories is out at 10 :30 AM EST. This is Major.
Treasuries
Traders, please note that we've changed the Bond instrument from the 30 year (ZB) to the 10 year (ZN). They work exactly the same.
We've elected to switch gears a bit and show correlation between the 10-year bond (ZN) and the S&P futures contract. The S&P contract is the Standard and Poor's, and the purpose is to show reverse correlation between the two instruments. Remember it's likened to a seesaw, when up goes up the other should go down and vice versa.
Yesterday the ZN hit a Low at around 9 AM EST but at the same time the S&P hit a High. If you look at the charts below the ZN gave a signal at around 9 AM and the ZN continued its Upward trend. Look at the charts below and you'll see a pattern for both assets. S&P hit a High at around 8:30 AM and migrated Lower. These charts represent the newest version of MultiCharts and I've changed the timeframe to a 15-minute chart to display better. This represented a Long opportunity on the 10-year note, as a trader you could have netted about 30 ticks per contract on this trade. Each tick is worth $15.625. Please note: the front month for the ZN is now Jun '23. The S&P contract is also Jun' 23. I've changed the format to filled Candlesticks (not hollow) such that it may be more apparent and visible.
Charts courtesy of MultiCharts built on an AMP platform
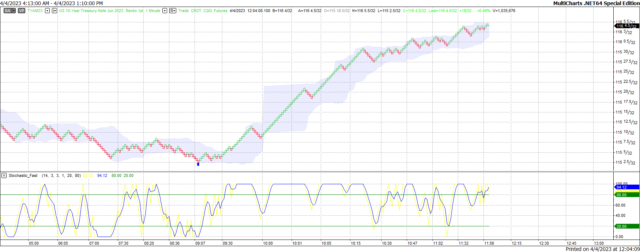
ZN - Jun 2023 - 4/4/23
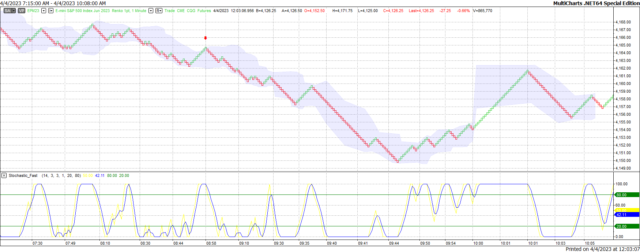
S&P - Jun 2023 - 4/4/23
Bias
Yesterday we gave the markets an Upside bias as the indices was correlated that way. The markets had other ideas as the Dow dropped 199 points and the other indices lost ground as well. Today we aren't dealing with a correlated market and our bias is Neutral.
Could this change? Of Course. Remember anything can happen in a volatile market.
Commentary
So, who could concentrate on trading yesterday when all of New York (and indeed the entire country) was glued to their TV sets to watch a once in a lifetime, never before indictment of a former President of the United States? I don't think the global markets paid attention to much else yesterday. The markets were correlated to go Higher and initially it appeared as though that might happen as the Dow did penetrate positive territory early yesterday. The economic news wasn't very encouraging as the Jolts Job Openings and Factory Orders did not meet expectation and the markets fell. So today we have ADP Non-Farm Employment Change and Crude Oil Inventories; both of which are major and proven market movers. Perhaps this may help to put the markets in their proper place? As in all things only time will tell.
Author

Nick Mastrandrea
Market Tea Leaves


