Trend P.I. Results & Update: The S&P 500 declined about 3% during the past week

SPECIAL ANNOUNCEMENT – Monday, September 05 is a US Holiday, Labor Day. There will be limited or no day session markets. Have A Great Weekend!
Recap Week of 8/29 – 9/02 - The S&P opened 8/29 with a 29 gap down open and then rallied 34 handles into a 1:44 PM high of the day. From that high, the S&P rolled over and declined 94 handles into an 8/30 – 10:50 AM low of the day. From that low, the S&P traded mostly sideways, culminating with a 2:44 PM low. From that low, the S&P rallied 41 handles into an 8/31 – 9:52 AM high. From that high, the S&P declined 111 handles into a 9/01 – 11:04 AM low. From that low, the S&P rallied 112 handles into a 9/02 – 10:46 AM high of the day. From that high, the S&P declined 117 handles into a 3:42 PM low. From that low, the S&P rallied 16 handles into the close.
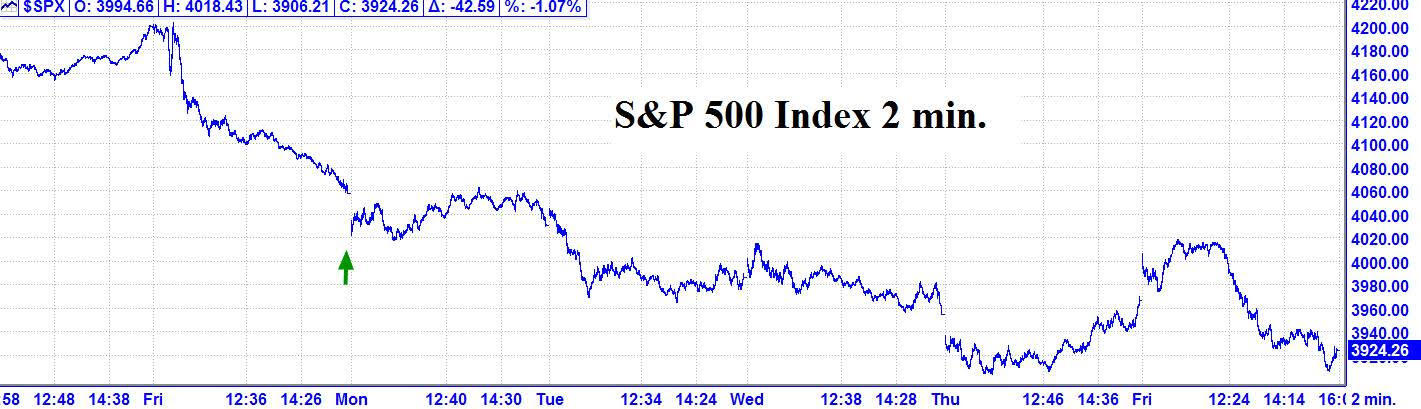
9/02 – The major indices had a big down day to finish with the following closes: DJIA - 327.98; S&P 500 - 42.59; and the Nasdaq Comp. - 154.26.
Looking Ahead – The S&P despite some wild whipsaws, declined about 3% during the past week. Over the 9/02 weekend, we have Venus at Perihelion, so we will be watching for a possible low early Tuesday, when the market re-opens. Please see details below.
The Now Index is in the BUY ALERT ZONE. This is a cautionary indication of a moderate imbalance of too many shorts.
This is not an outright buy signal.
Coming events
(Stocks potentially respond to all events).
9/02 AC – Venus Perihelion. Major change in trend Cattle, Copper, Corn Cotton, Gold, OJ, Sugar, Wheat.
A. 9/09 AC – Mercury in Libra turns Retrograde. Major change in trend Corn, Oats, Soybeans, Sugar, WHEAT.
9/09 AC – Full Moon in Pisces. Major change in trend Financials, Grains, Precious Metals, C.I., Oil.
9/09 AC – Jupiter 90 US Jupiter. Major change in trend US Stocks, T-Bonds, US Dollar.
Market math
9/09 = 14,641 (121^2) days > 8/09/1982 MAJOR LOW.
9/30 = 5,468 (Music) days > 10/11/2007 MAJOR HIGH.
Fibonacci – 9/2, 9/12, 9/15, 9/23, 9/27.
*DJIA – 9/12, 9/14, 9/22, 9/27.
*NYSE – 9/13, 9/26.
Astro – 9/6, 9/12, 9/19, 9/26, 9/27, *9/30 AC.
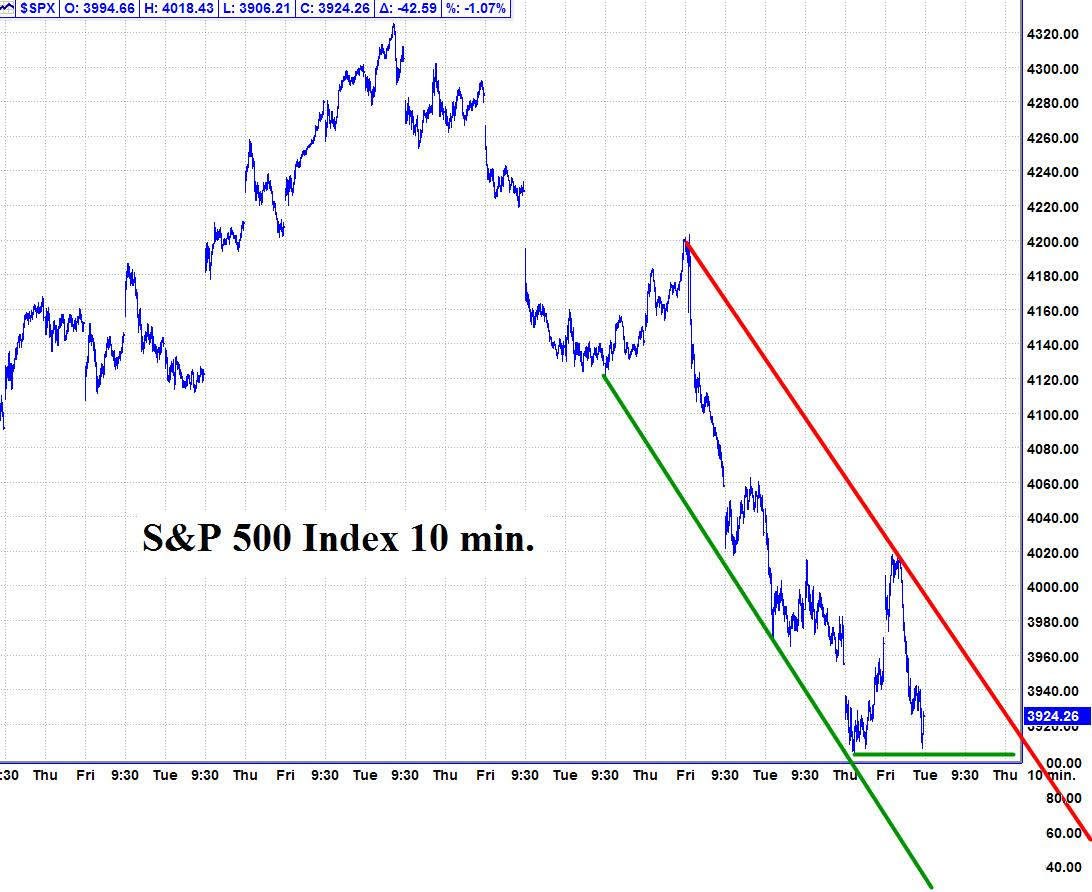
Please see below the S&P 500 10 minute chart.
Support - 3903, 3790 Resistance – 3980.
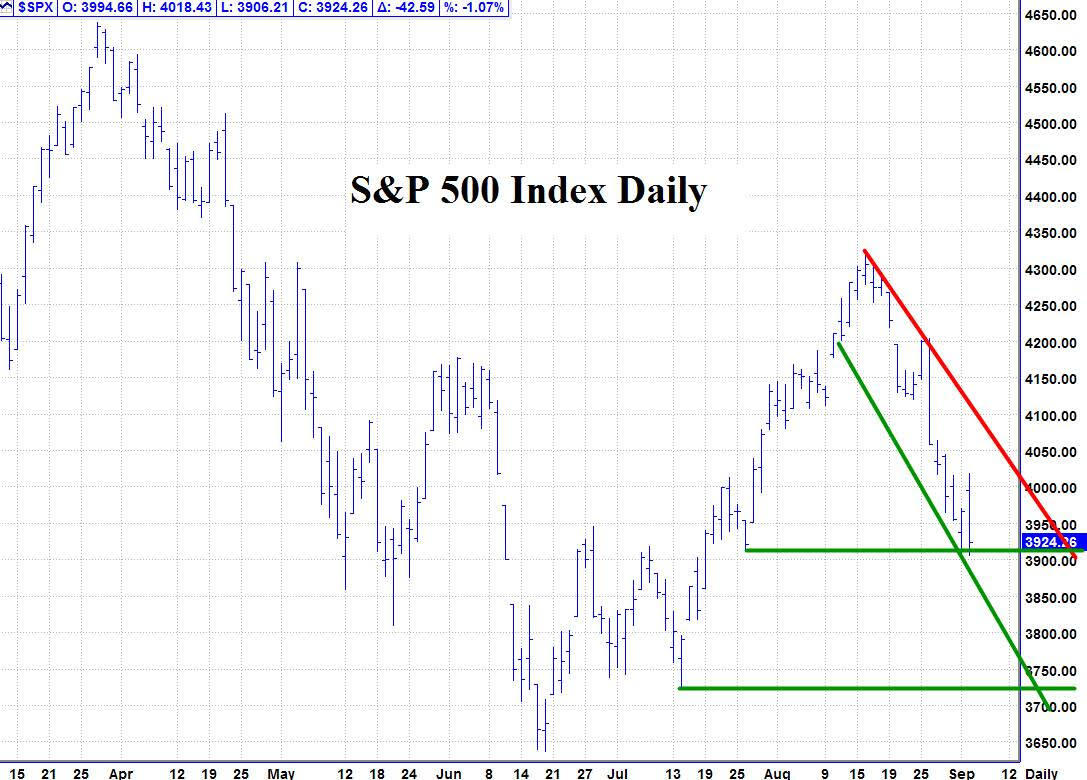
Please see below the S&P 500 Daily chart.
Support - 3903, 3790, 3730 Resistance – 3980.
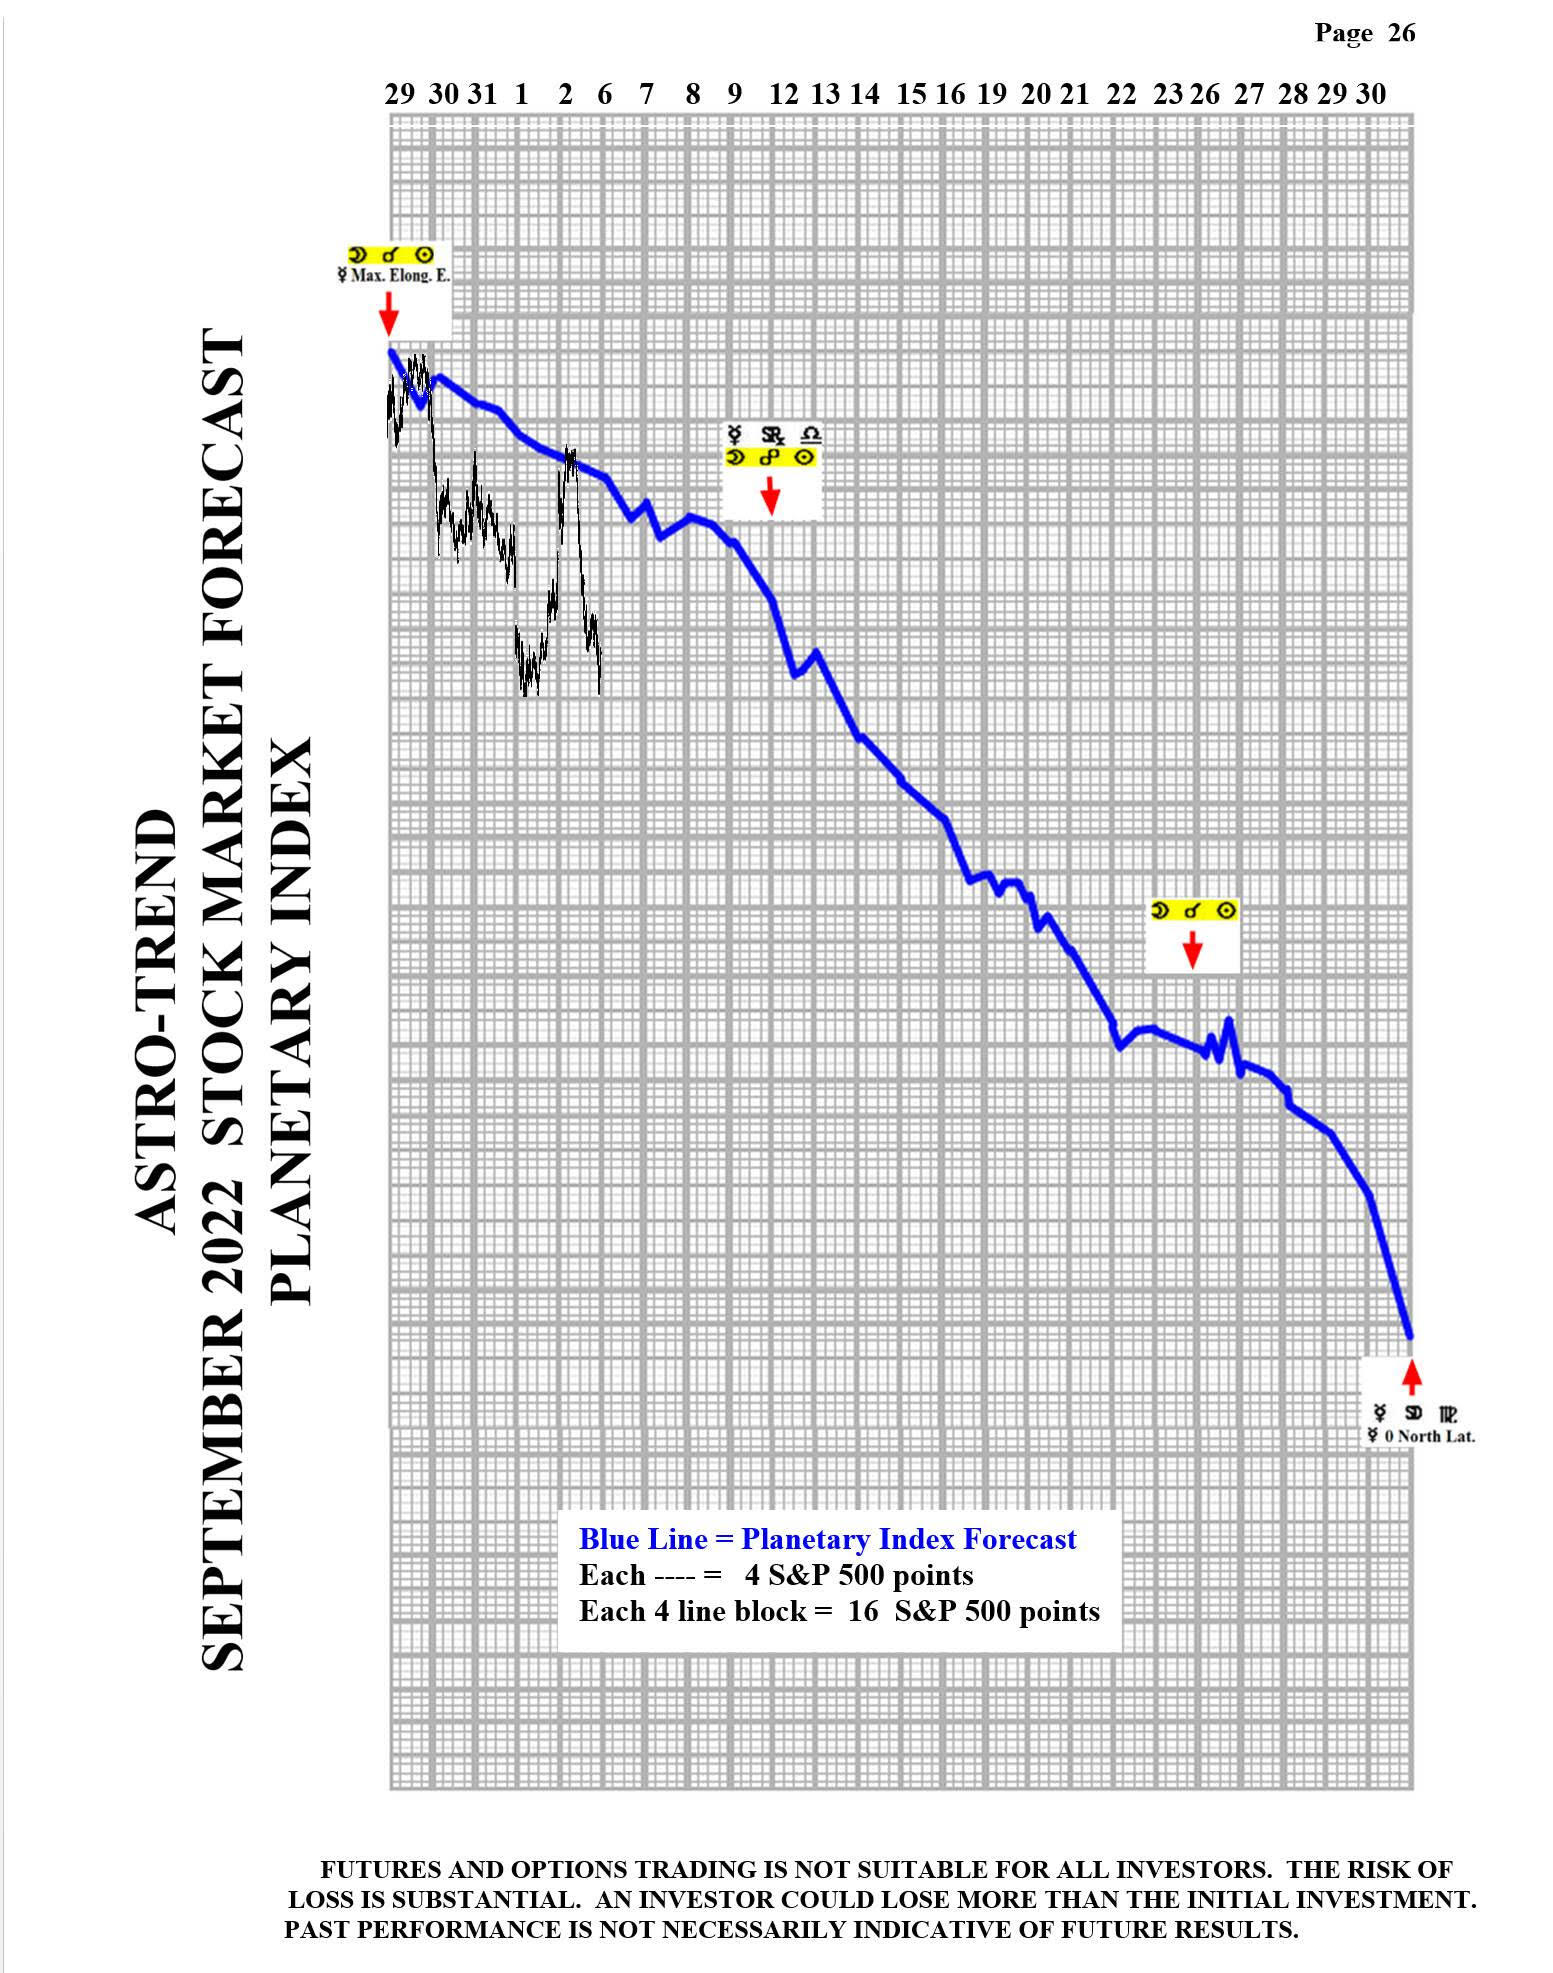
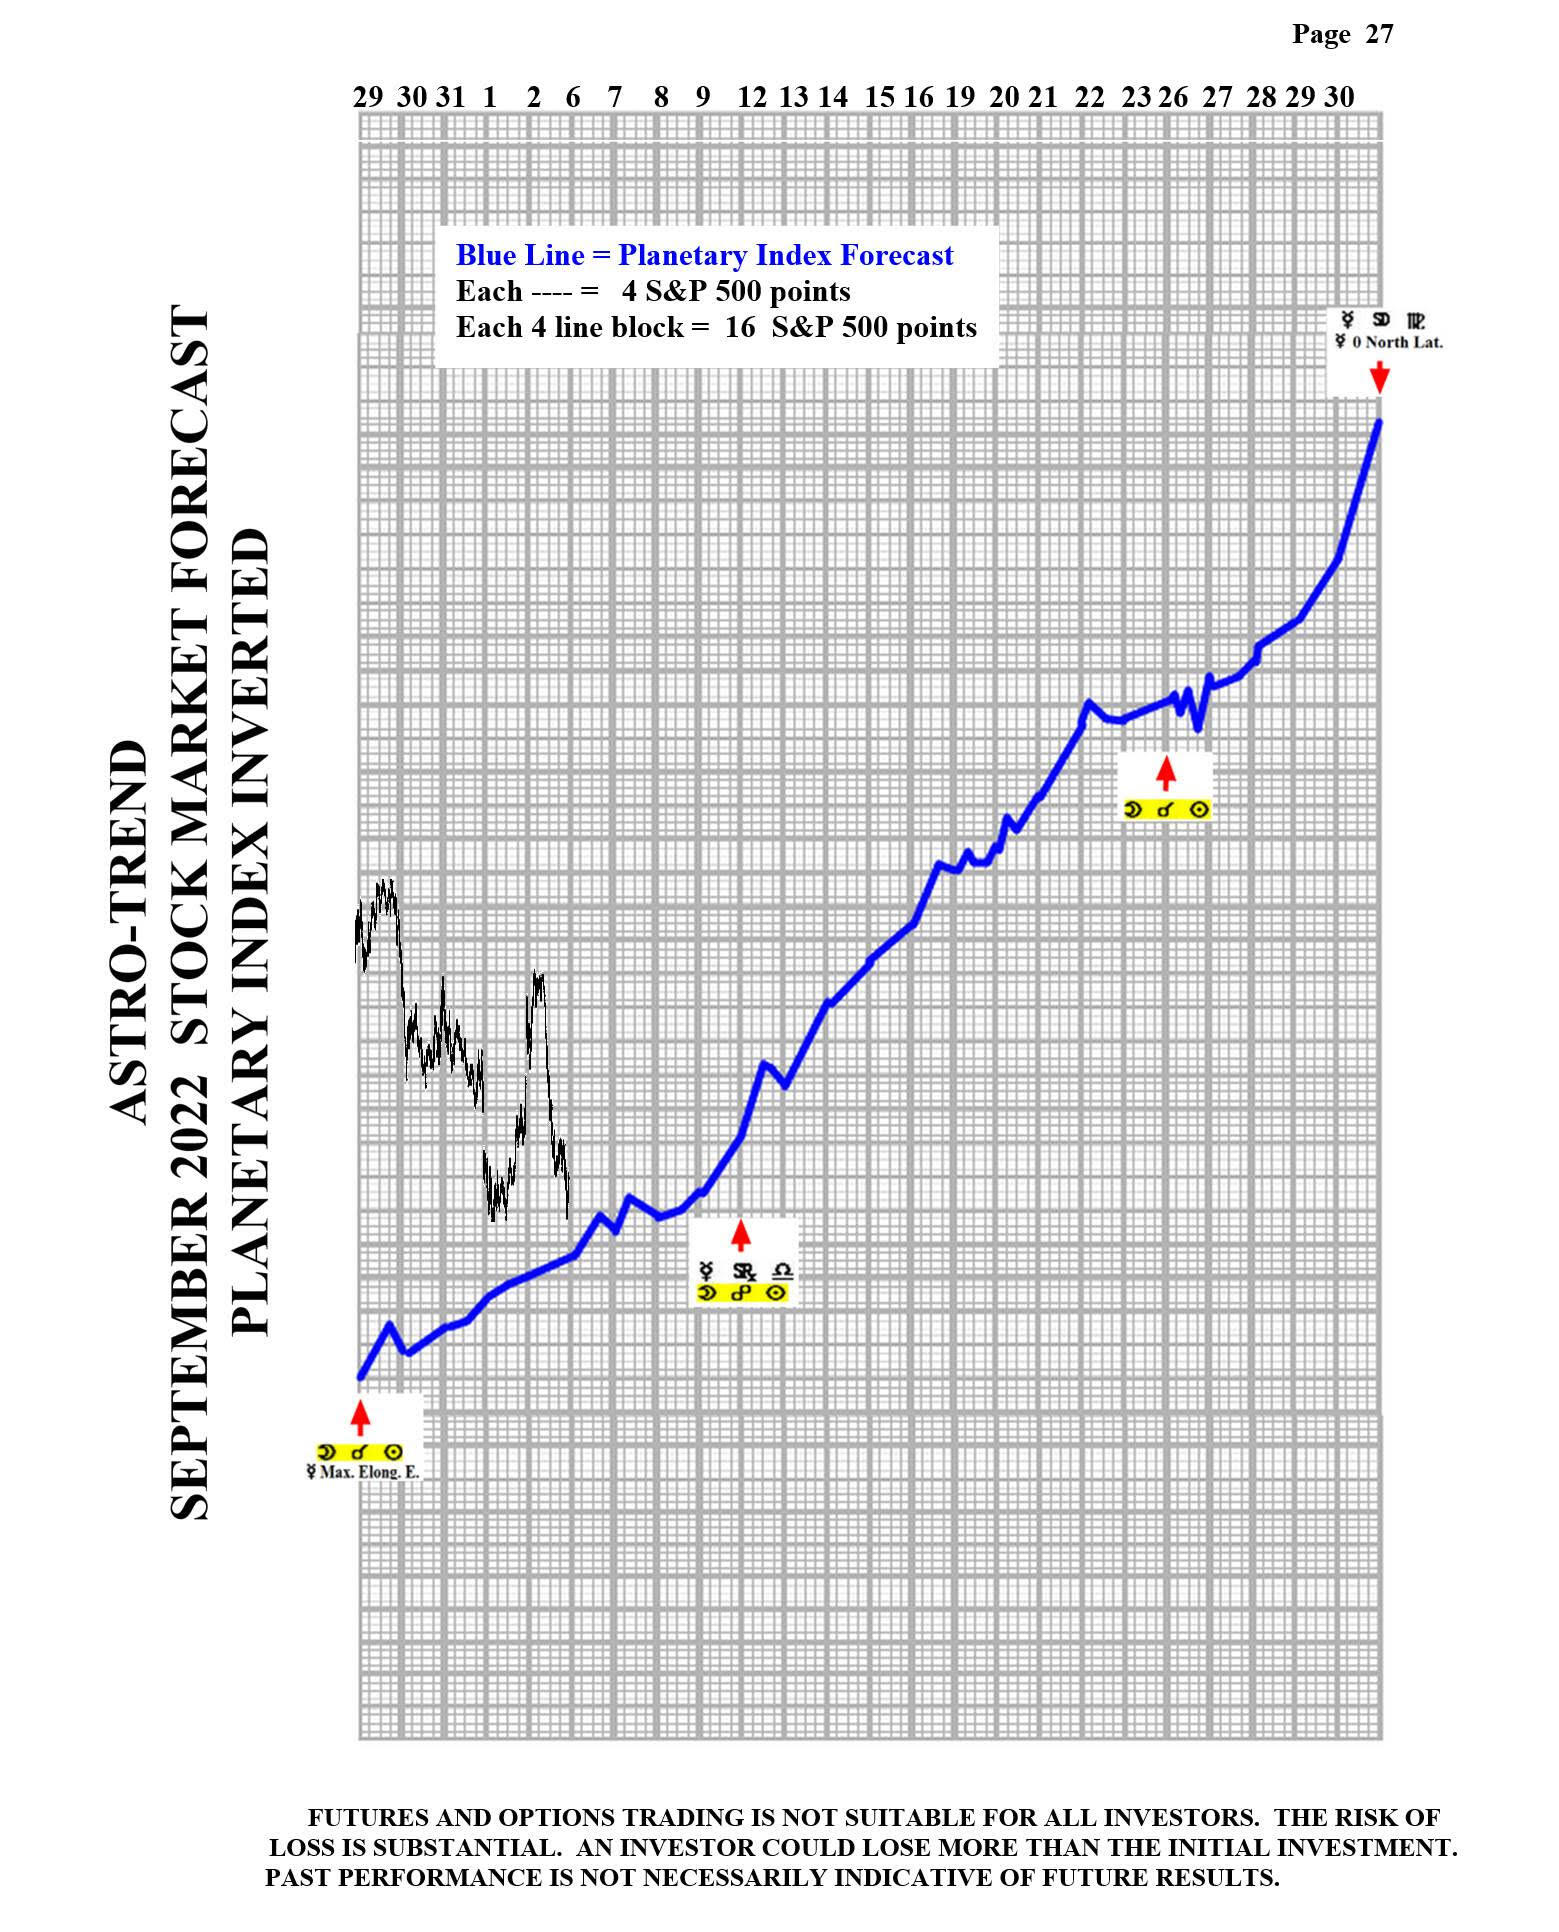
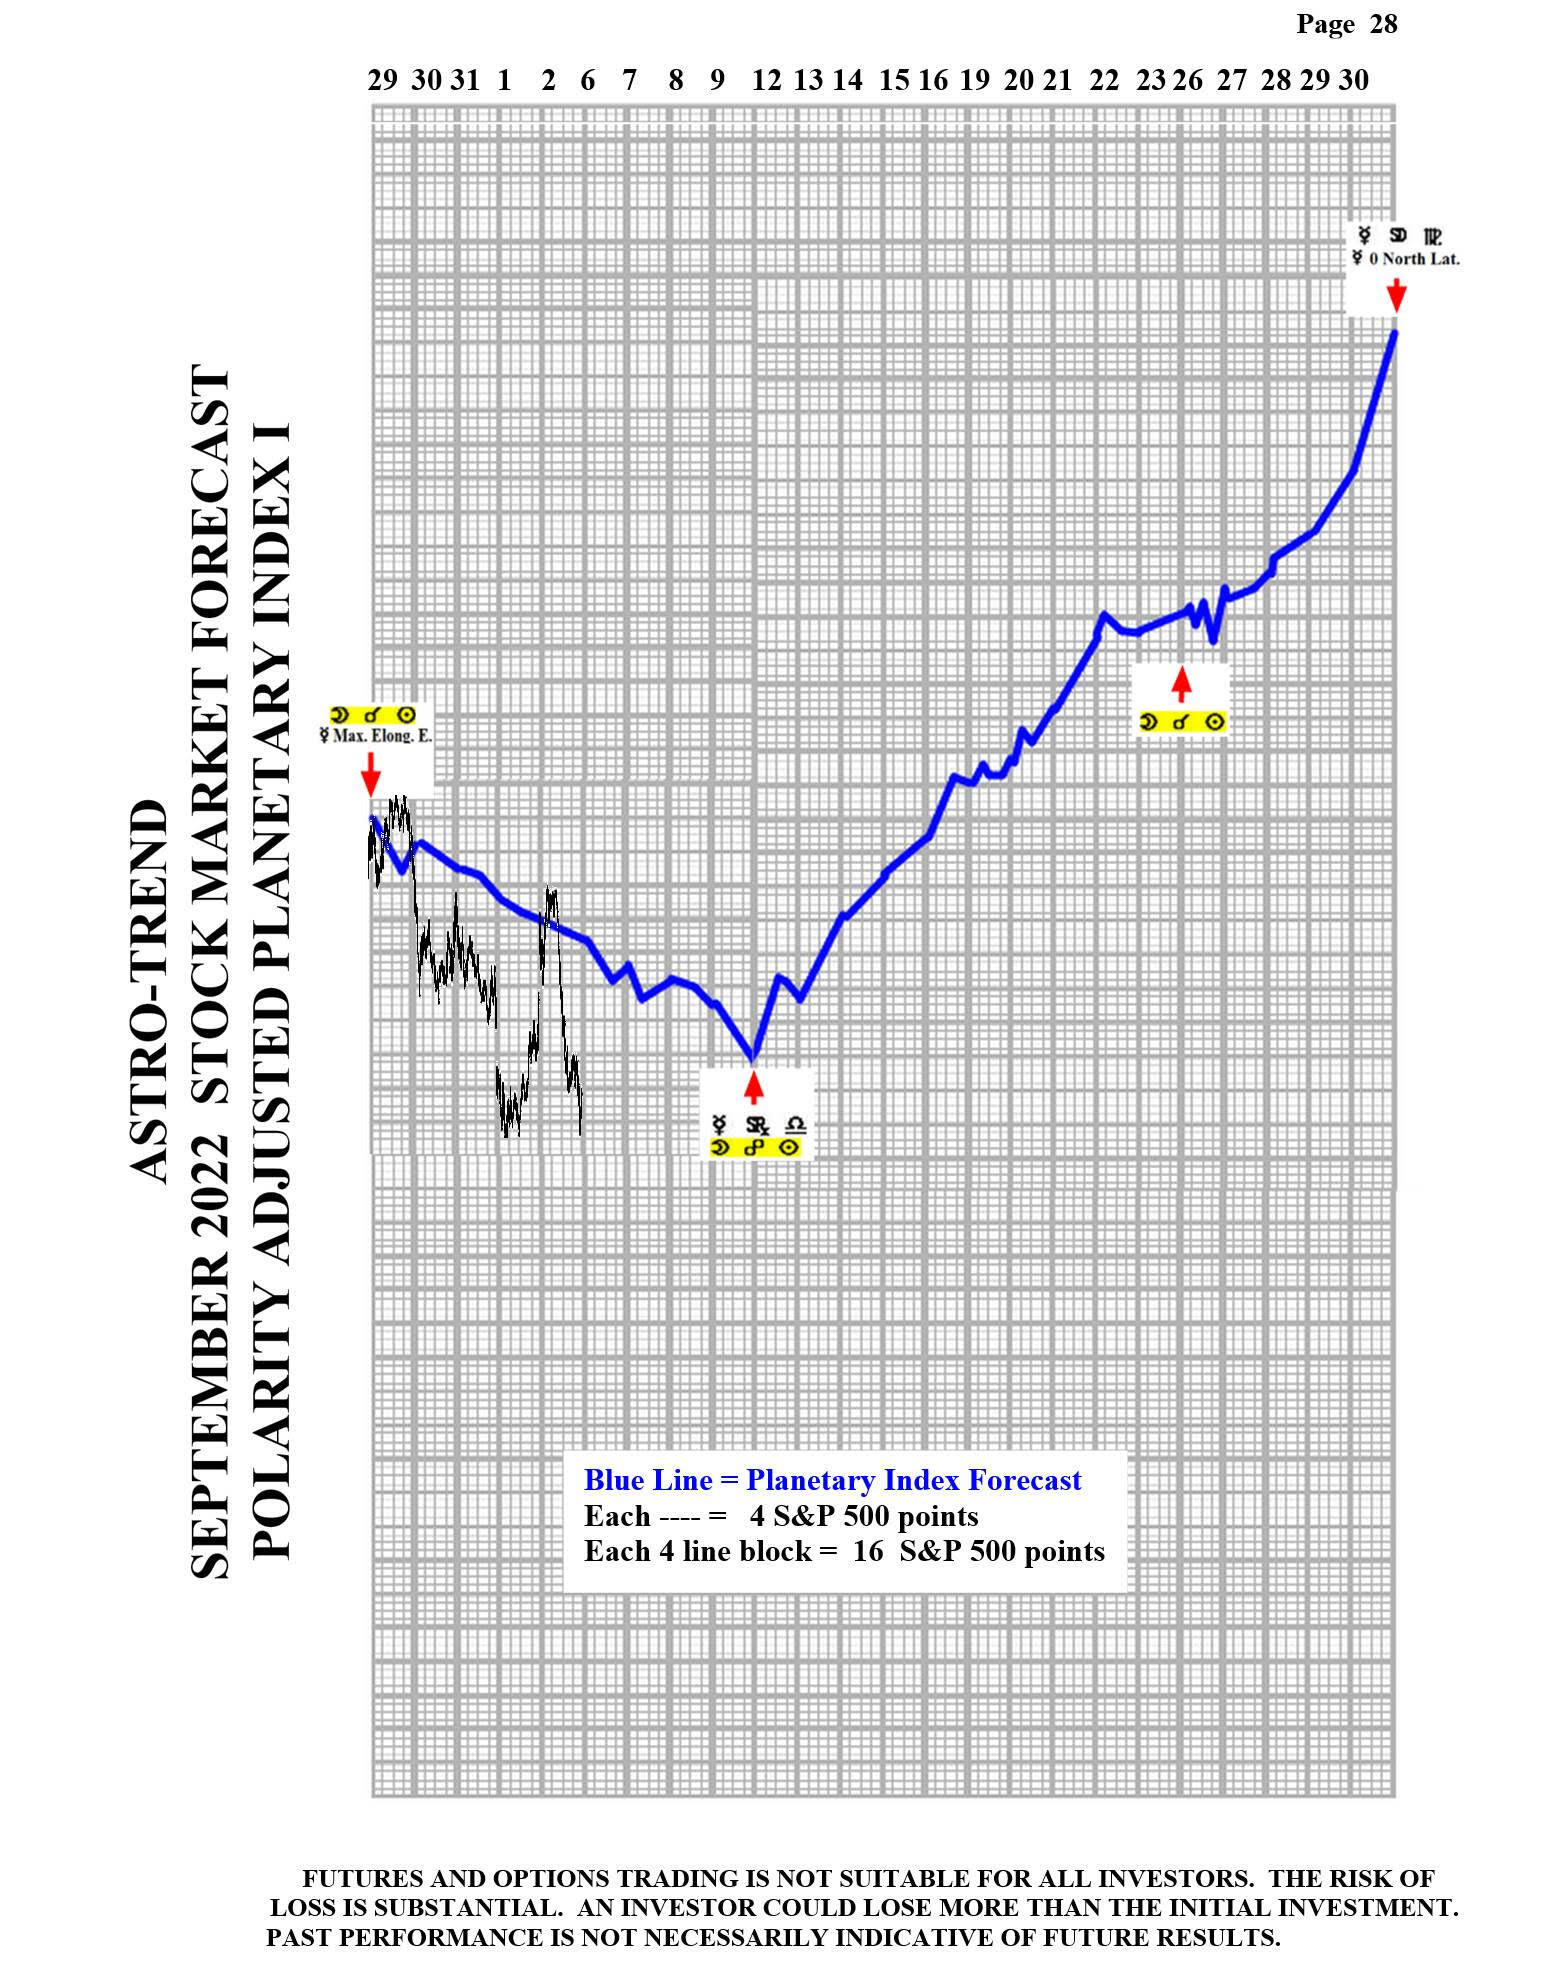
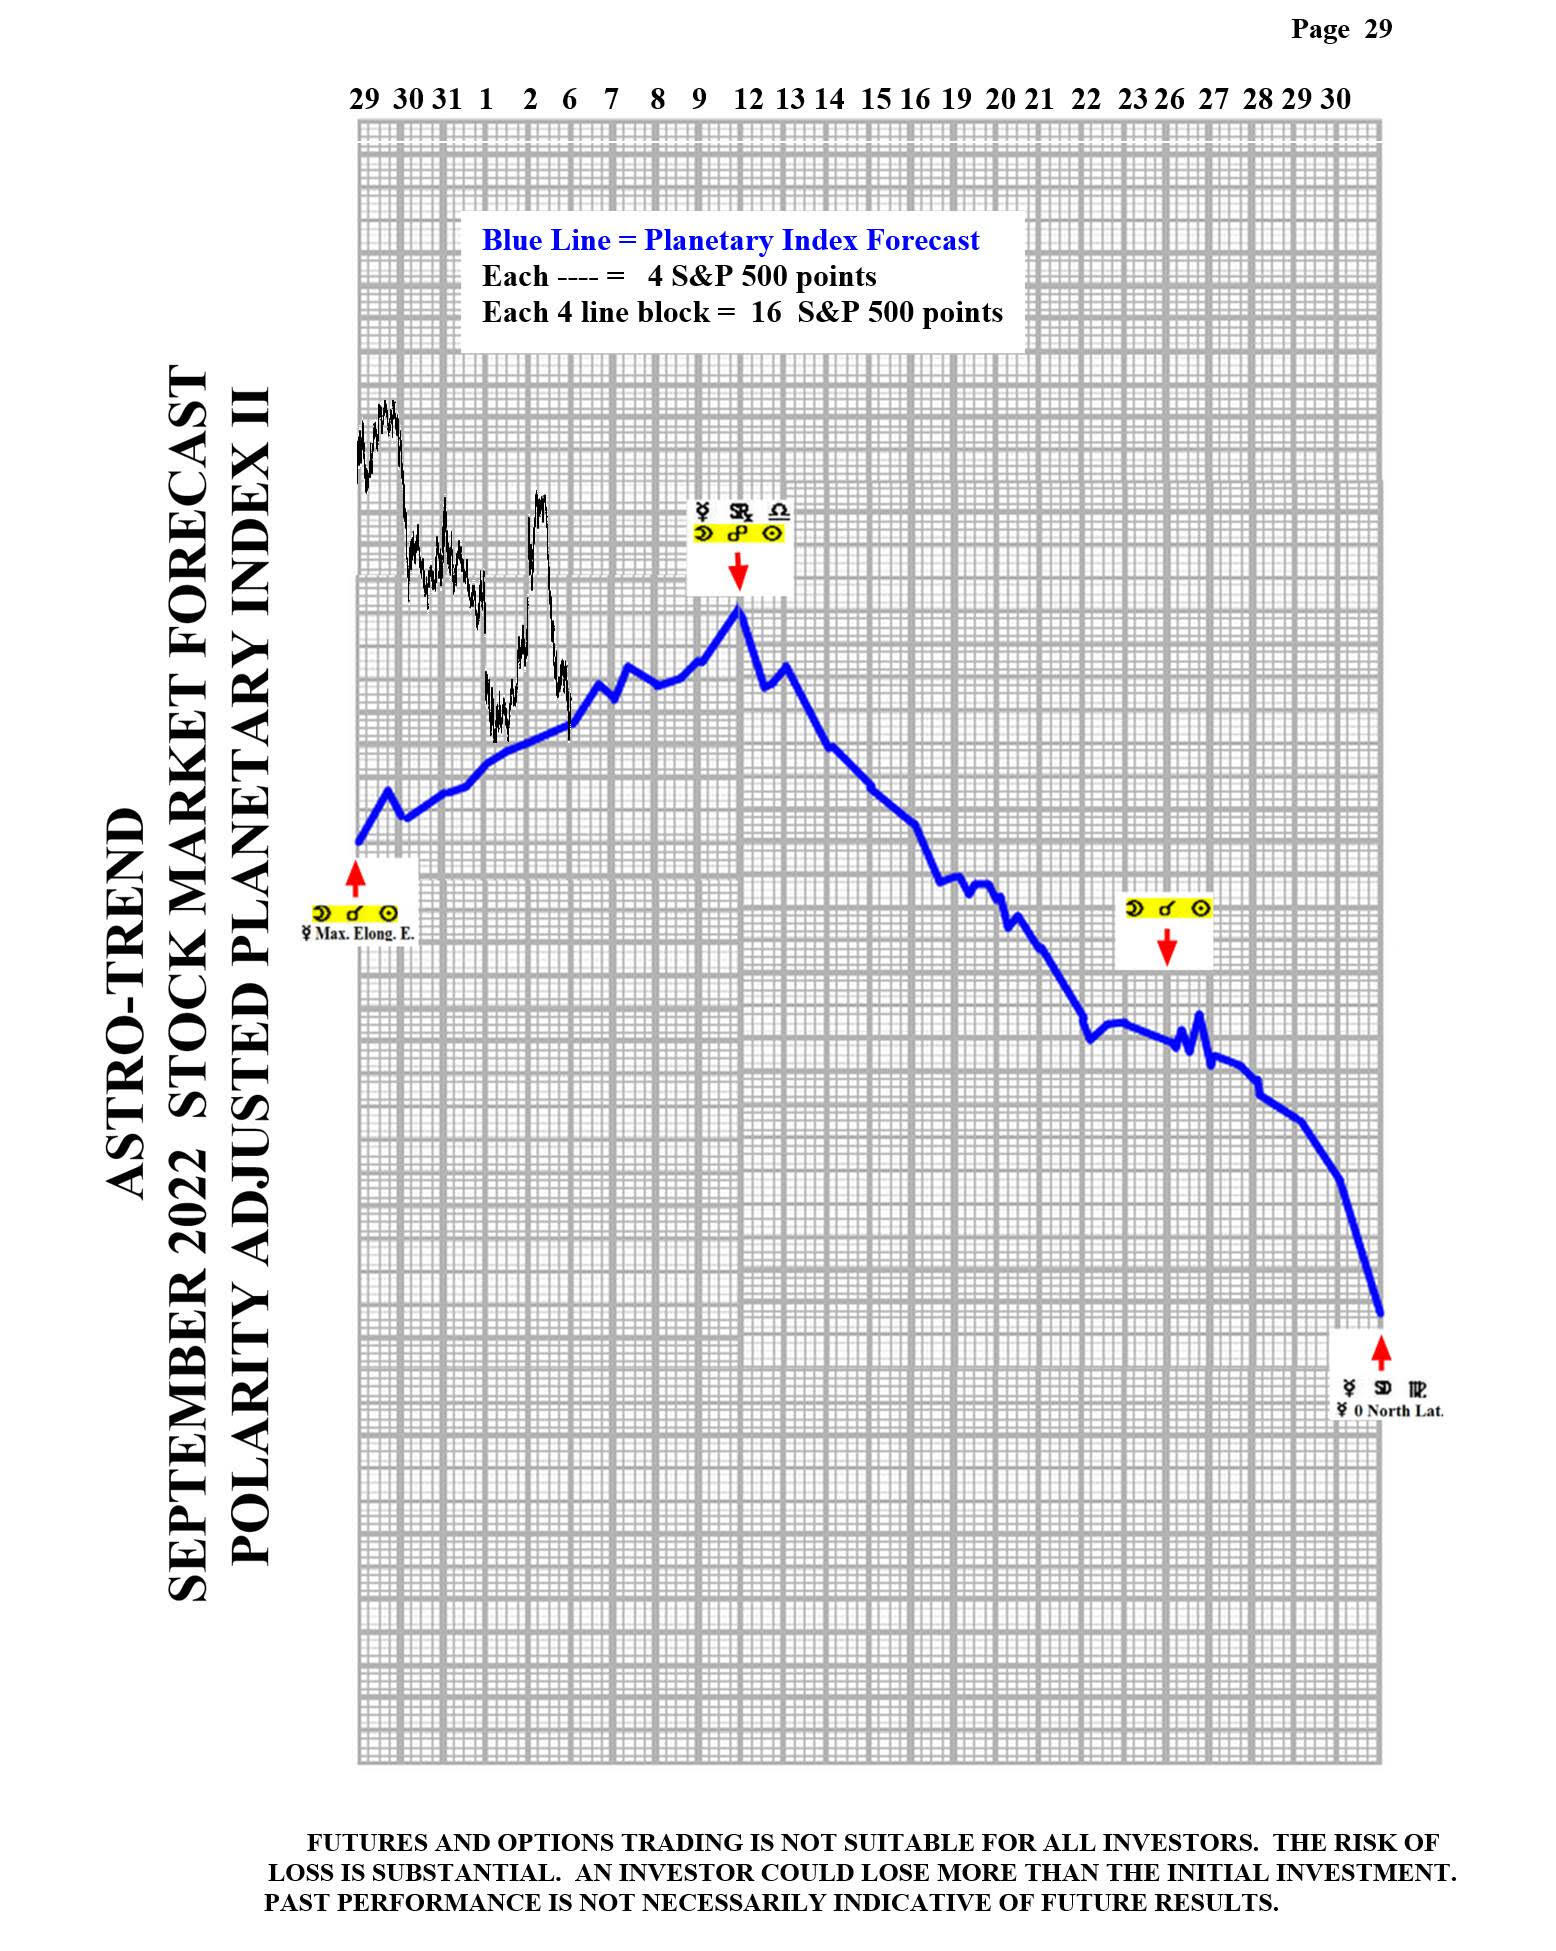
Please see below the September Planetary Index charts with S&P 500 5 minute bars for results.
Author

Norm Winski
Independent Analyst
www.astro-trend.com


