Trade War Fears Again

There was some profit-taking action on Friday, as stocks retraced a part of their recent uptrend. However, the S&P 500 index remained very close to its week-long consolidation along the resistance level of around 2,800. Is this some short-term topping pattern before a downward reversal? Or just a quick downward correction? There are still two possible medium-term scenarios.
The U.S. stock market indexes lost 0.1-0.3% on Friday, as investors' sentiment worsened following the recent Central Banks' monetary policies releases, along with renewed trade war fears. The S&P 500 index is still close to its mid-March local high of around 2,800. It currently trades 3.2% below January's 26th record high of 2,872.87. The Dow Jones Industrial Average lost 0.3%, and the technology Nasdaq Composite lost 0.2% on Friday.
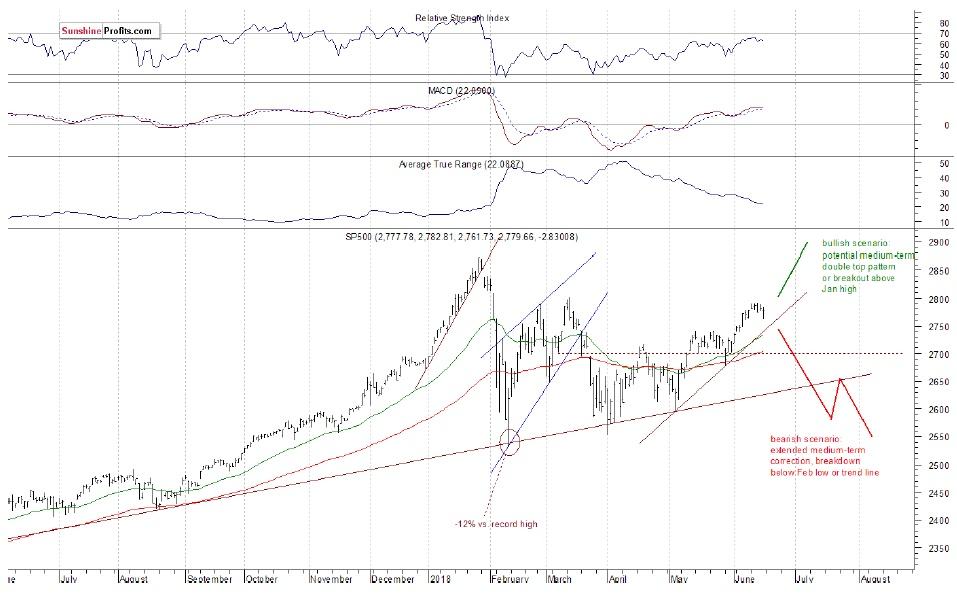
The nearest important level of resistance of the S&P 500 index remains at around 2,7902,8 00, marked by the recent local highs along with mid-March local high. The next resistance level is at 2,830-2,840, marked by the late January short-term consolidation. On the other hand, support level is at 2,760-2,765, marked by the recent local lows. The next level of support is at 2,750, marked by previous level of resistance. The support level is also at 2,7352,740, marked by last week's Monday's daily gap-up of 2,736.93-2,740.54.an extended flat correction):
The broad stock market accelerated its short-term uptrend in the early June following the S&P 500 index' breakout above the resistance level of 2,750. Will it continue higher? We continue to see investors' uncertainty and profit taking action, because the market is close to the resistance level of around 2,800. There are still two possible medium-term scenarios bearish that will lead us below February low following trend line breakdown, and the bullish one in a form of medium-term double top pattern or breakout towards 3,000 mark. There is also a chance that the market will just go sideways for some time, and that would be positive for bulls in the long run (some kind of an extended flat correction):
Negative Expectations, Correction to Continue?
Expectations before the opening of today's trading session are negative, because the index futures contracts trade 0.5-0.6% below their Friday's closing prices. The European stock market indexes have lost 0.3-1.2% so far. Investors will now wait for the NAHB Housing Market release at 10:00 a.m. Investors will also wait for some speeches from the FOMC's Members today, along with a speech from ECB's President Mario Draghi at 1:30 p.m. The broad stock market will likely retrace its Friday's intraday bounce off support level. But will it continue lower today? It's hard to say. If the S&P500 index breaks below the level of around 2,750-2,760, we could see some selling pressure.
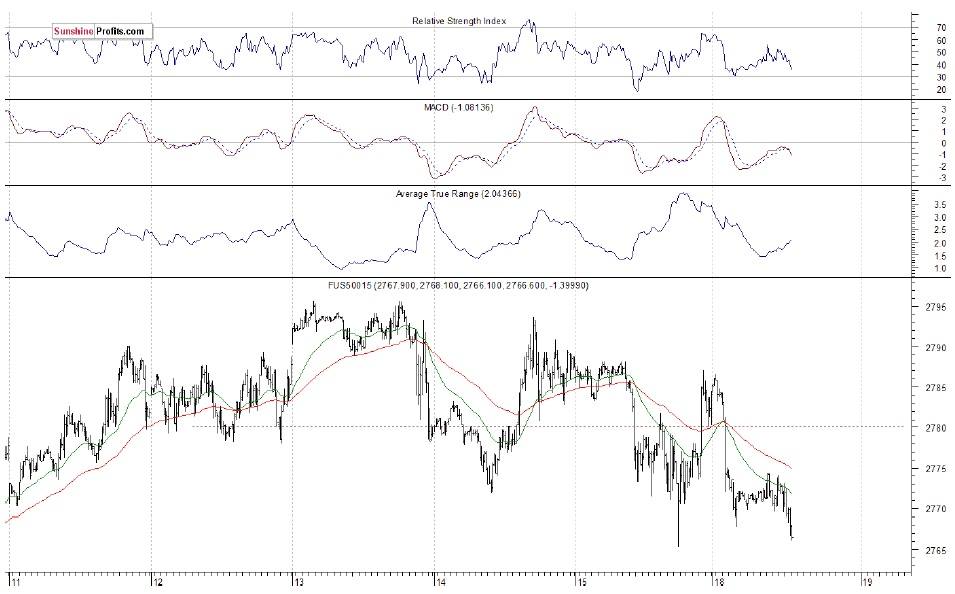
The S&P 500 futures contract trades within an intraday consolidation following an overnight move down. The nearest important level of support is at around 2,765, marked by Friday's short-term local low. The next support level is at 2,750. On the other hand, resistance level is at 2,780-2,800, marked by the recent local highs. The futures contract trades close to its Friday's local low again, as the 15-minute chart shows:
Nasdaq Backs Off from Record High
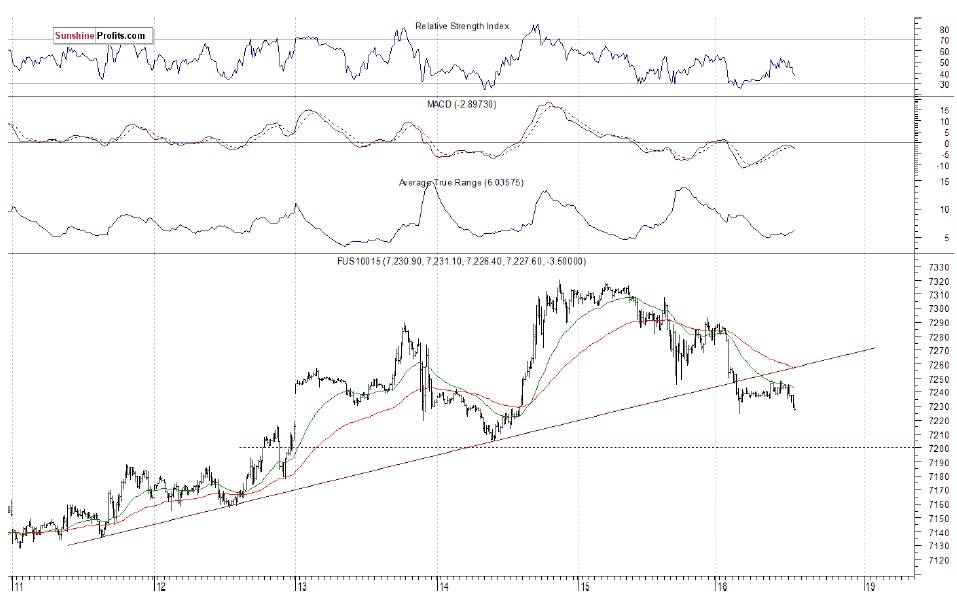
The technology Nasdaq 100 futures contract retraced some of its recent move down following bouncing off Thursday's new record high of around 7,320. The market fell almost 100 points from that level. For now, it looks like a downward correction. The nearest important level of support is at around 7,200, marked by previous resistance level. The support level is also at 7,000-7,100. On the other hand, the nearest important level of resistance is now at 7,2807,300, marked by some short-term local highs. The Nasdaq futures contract trades below its short-term upward trend line, as the 15-minute chart shows:
Apple, Amazon - Just Short-Term Consolidation?
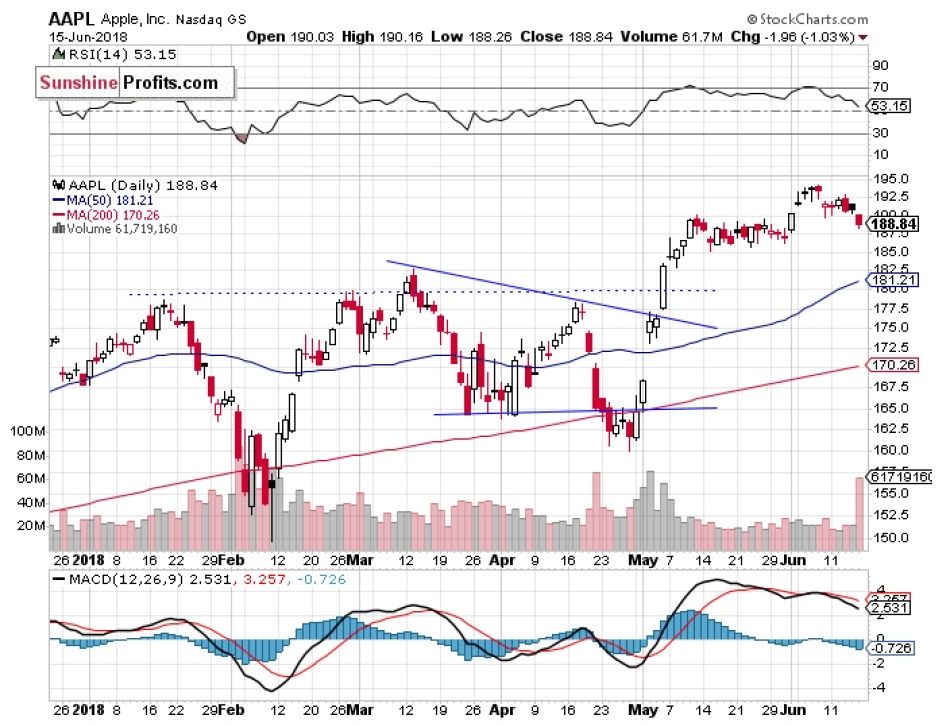
Let's take a look at Apple, Inc. stock (AAPL) daily chart. It reached new record high more than a week ago, as it slightly extended its short-term uptrend following a breakout above the price of $190. Then the stock retraced some of its advance, as it fell below $190 again. Investors' sentiment remains bullish, but will the uptrend continue? There have been no confirmed negative signals so far. For now, it looks like a short-term consolidation:
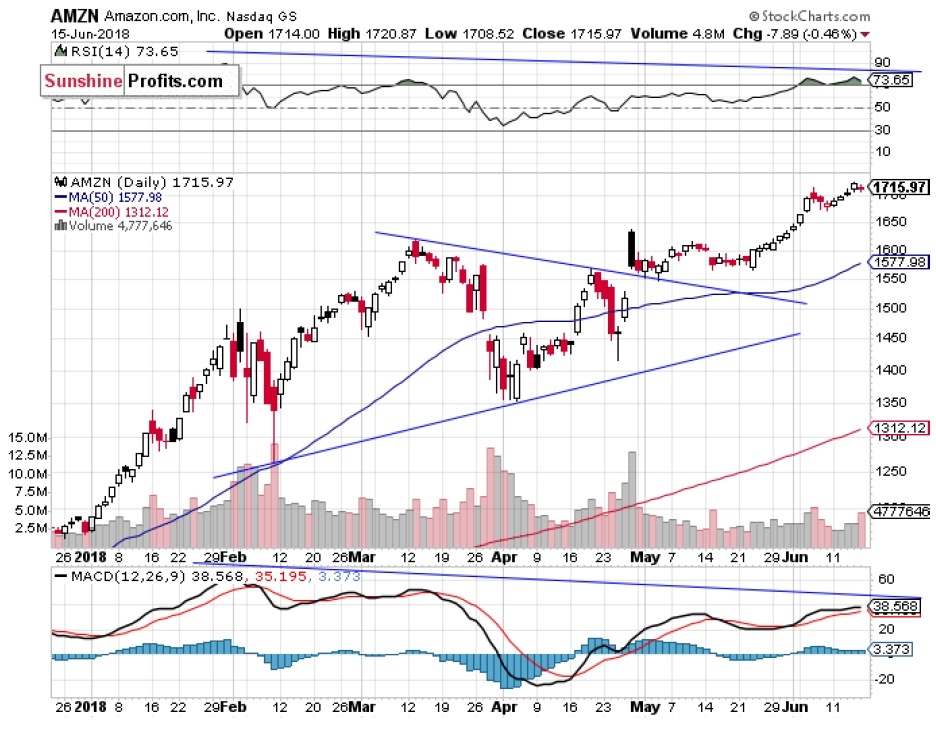
Now let's take a look at Amazon.com, Inc. stock (AMZN) daily chart. It reached new record high on Thursday. Then it retraced some of its recent advance on Friday. Is this a topping pattern before a downward reversal? There have been no confirmed negative signals so far. However, we can see some negative technical divergences that may lead to a downward correction:
Dow Jones Relatively Weaker Again
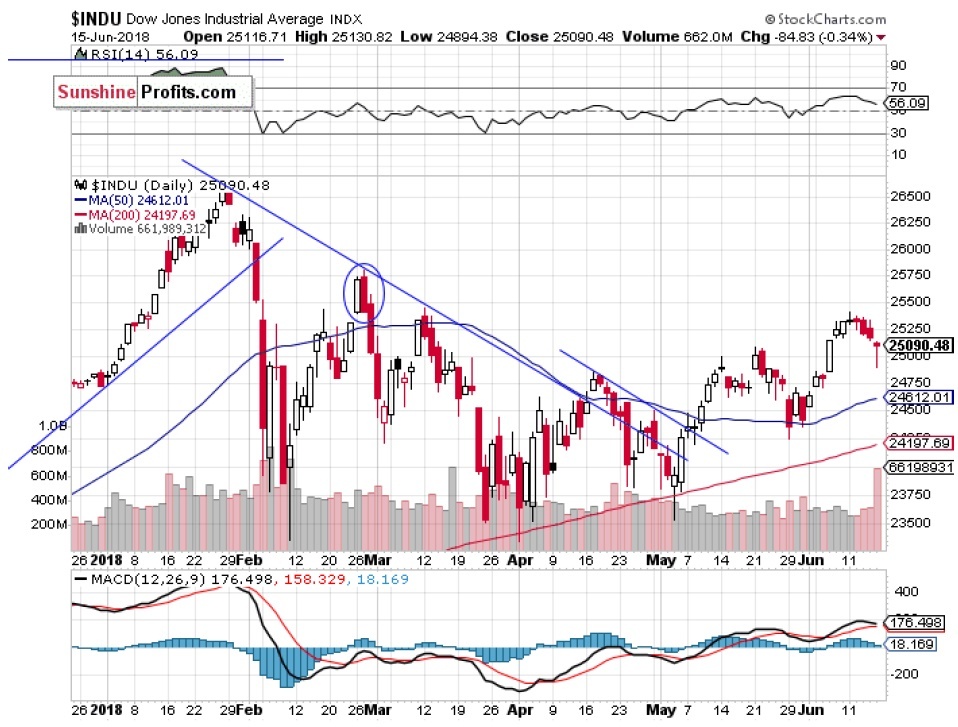
The Dow Jones Industrial Average broke below its short-term consolidation on Friday, but it remained above the level of 25,000. So was this just a downward correction or some negative downward reversal? The level of resistance remains at around 25,400-25,500, marked by midMarch local high. On the other hand, support level is at 24,800, among others:
The S&P 500 index traded within a short-term consolidation last week, but it broke slightly lower on Friday. It fell the lowest since previous Friday, before bouncing off a support level and retracing its intraday move down. So is this a bullish or bearish price action? For now, it looks like some downward correction, and the market is still close to the resistance level.
Want free follow-ups to the above article and details not available to 99%+ investors? Sign up to our free newsletter today!
Author

Paul Rejczak
Sunshine Profits
Paul Rejczak is a stock market strategist who has been known for the quality of his technical and fundamental analysis since the late nineties.


