Trade disruption dominates sentiment flow as dollar bounces back

Market Overview
The signs of slowing economic activity arising from the US/China trade dispute continue to show. Friday’s disappointing jobs report from the US reflected a lower jobs number and less wages showing economic drag. However, also this morning, Chinese trade data has shown the strain. A larger than expected drop in May’s Chinese imports shows the strain that the domestic economy is facing and will feed through to concerns across supply lines. Although Chinese imports were slightly higher and better than expected, this was likely to have been artificially boosted by attempts to front run increases in US tariffs. However, market expectations are pretty low surrounding the trade story right now. It means that any news that hints at an improvement in the trade story will be met risk positive but also (for now) dollar positive reaction. One such positive move comes as the US has delayed imposing tariffs on Mexico over immigration concerns. Markets are having to now reassess expectations of an extremely tough to determine US trade policy. The Chinese yuan is under pressure from the rather pessimistic view of reasons behind the improvement in the China trade surplus today, but also something that is strengthening the dollar across the majors too. With better risk appetite today, gold is unwinding whilst equities are climbing again. For how long, could be dependent upon the next episode of US trade rhetoric.

Wall Street closed higher again which is the fourth consecutive strong session on the S&P 500 which was +1.0% at 2873. With US futures another +0.3% this morning, Asian markets have had a strong session with the Nikkei +1.2% whilst Shanghai Composite was +0.6%. European markets are looking well set at the open with both FTSE futures and DAX futures around +0.6% higher in the early moves. In forex, there is a broad rebound in USD, whilst also a nod to the Chinese trade data too. The dollar is broadly stronger this morning, looking to reclaim Friday’s payrolls related losses, whilst AUD and NZD (commodity currencies) are weaker in light of the disappointing Chinese imports. In commodities, the dollar strength is weighing on gold and silver (both around -1%), whilst oil is holding the recovery gains (oil fell sharply on the previous deterioration in the US/Mexico relations).
Traders will be on the lookout for a clutch of UK economic data this morning. UK monthly GDP for April at 0930BST is expected to be taken back to +0.4% on a three month basis (+0.5% last month). The UK Trade Balance for April is also at 0930BST and is expected to improve slightly to -£12.8bn (from -£13.7bn in March). UK Industrial Production is expected to drop back to +0.7% for the year in April (back from +1.3% in March). Into the afternoon, the focus switches to the US and the JOLTS jobs openings at 1500BST for April which are expected to improve very slightly to 7.50m (from 7.49m in March).
Chart of the Day – EUR/JPY
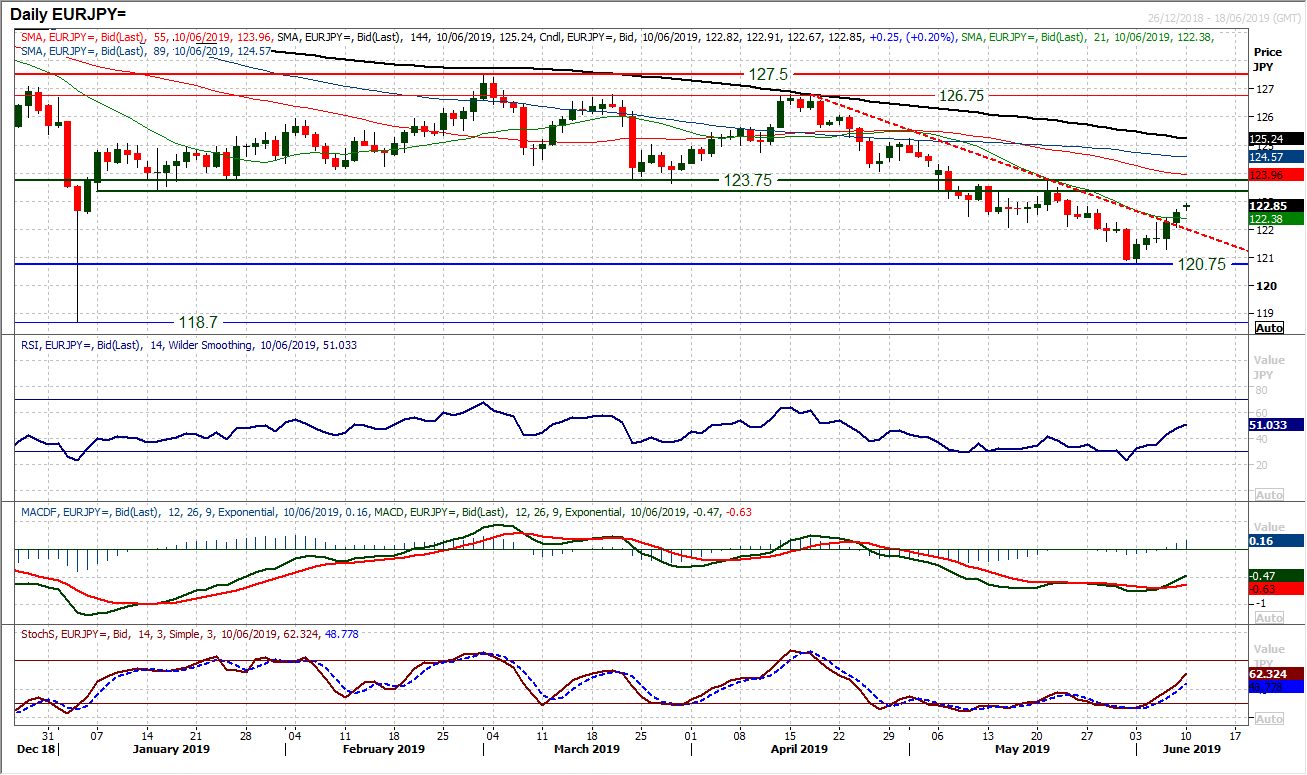
A technical rally is underway. For the past seven weeks the market has been trending lower, however this is now changing. A run of positive closes has now resulted in a break of the multi-week downtrend. Given that the breakout is being confirms on momentum indicators, the prospect of a further recovery in the coming days is elevated. A MACD buy signal, along with RSI at a multi-week high and Stochastics also improving strongly, means the momentum is behind a recovery now. This is likely to see the pair return to the key medium term pivot of overhead supply band at 123.40/123.75. This comes with what is actually a head and shoulders base pattern on the hourly chart which through 122.25 implies 150 pips to 123.75. There is breakout support 122.10/122.40 which is a near term gauge. Initial resistance at is an old pivot around 123.05.
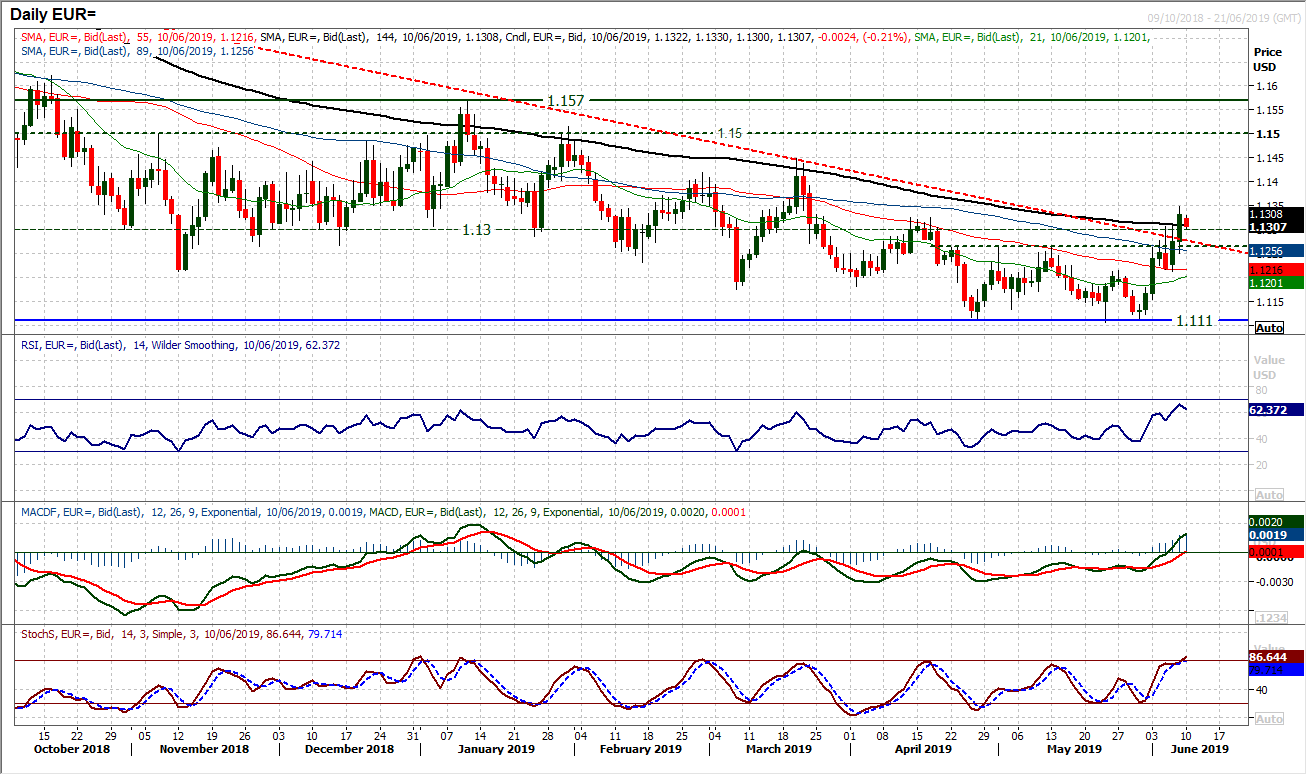
There have been some big candles in recent sessions as EUR/USD has finally begun go find some intraday volatility. The Average True Range is now up to 60 (having been as low as 44 a couple of weeks ago). Another significant session on Friday has also taken the market through a couple of key resistances. Resistance at $1.1265 had been restrictive for more than a month, with $1.1300 an old key floor and basis of overhead supply. Both were decisively cleared on Friday. A candle which also took the market above all the moving averages, whilst decisively breaking a nine month downtrend. This reflects euro recovery but also dollar weakness. But can this move to a two month high be sustained? Today’s session is key, and already the market is slipping back towards the $1.1300 breakout. Holding this breakout is a first test, but the $1.1265 level which is now supportive is more important. Momentum is positive across the indicators now, but this improvement needs to be held. An instant unwind after a strong breakout needs to be confirmed. Key support to abort the move is at $1.1215.
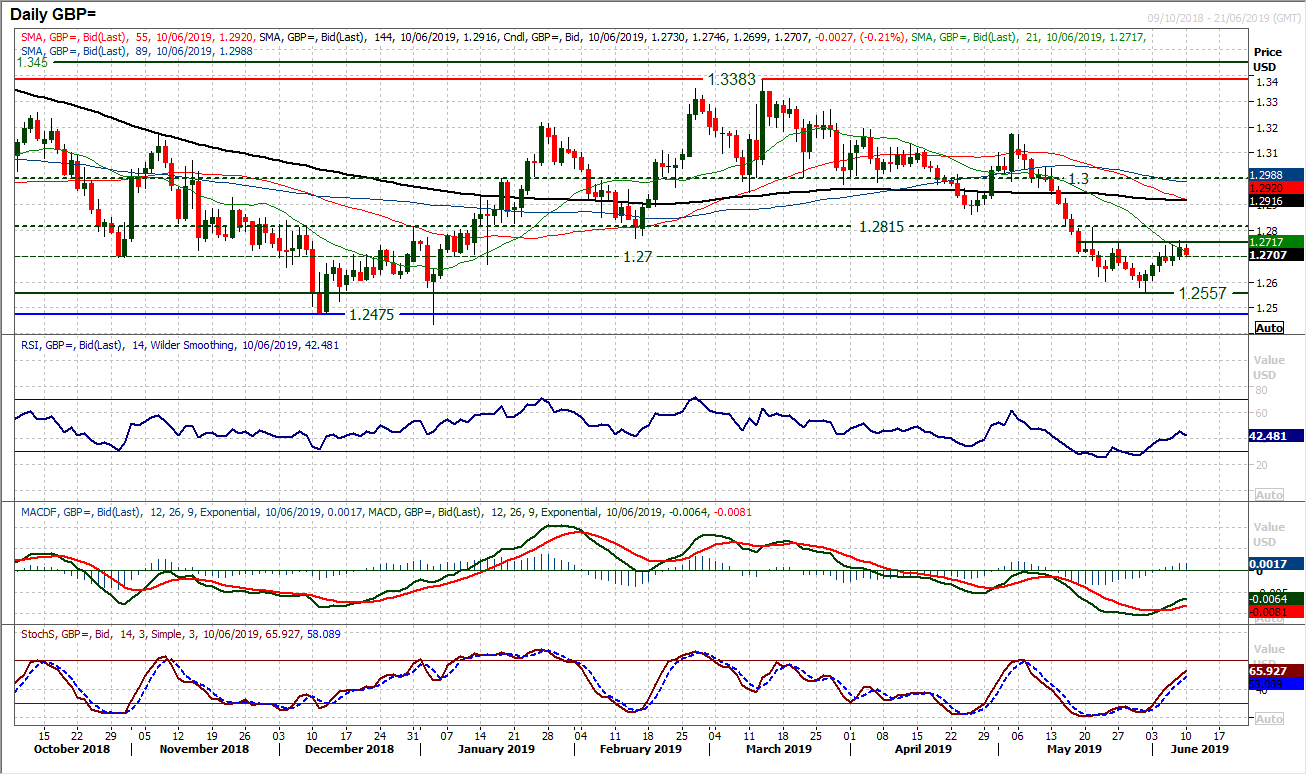
Cable has been edging higher in recent sessions (rather than the strong moves of EUR/USD). This has seen the market test the near term resistance at $1.2755 but fail to make the key break that would have completed a base pattern. Friday’s mild bull candle intraday tested above, but the market pulled back and shied away again at $1.2762. The hourly chart shows a positive bias still continues, but within what is a range play. Whilst the support at $1.2665 remains intact, the prospect of continued recovery will be on the table, but for now, we wait. Back under the $1.2665 min higher low would re-open the recent low at $1.2557 again. Watch daily momentum indicators too, with RSI and MACD lines making heavy work of recovery, whilst Stochastics are threatening to roll over. Above $12755 opens $1.2815.
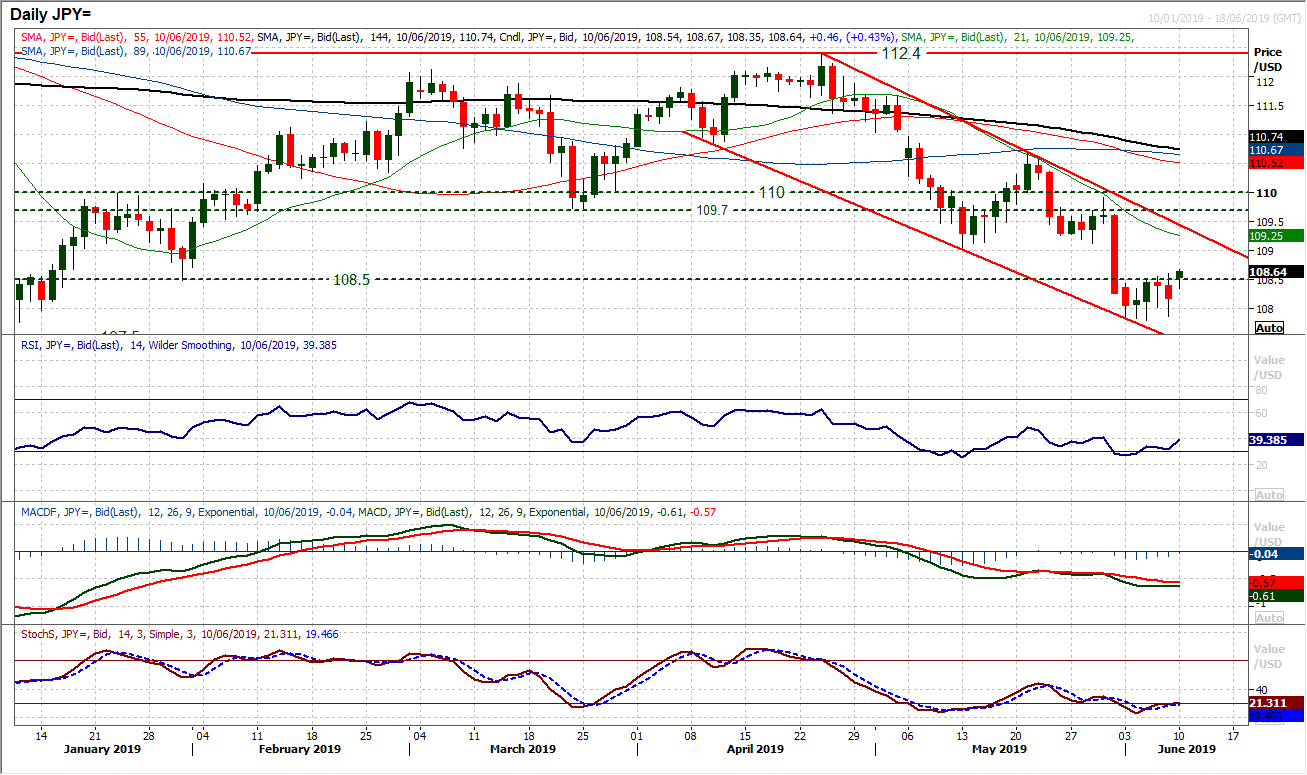
Another storm was weathered by the dollar bulls in the wake of the payrolls report disappointment on Friday. Holding on to the support at 107.80 the bulls have responded by pulling higher this morning, back above 108.50 which is now effectively completing a near term base pattern. A strong reaction this morning, is starting to pull momentum indicators higher, with RSI confirming the move. MACD and Stochastics are yet to decisively respond, but there is a degree of bottoming on these indicators now. Closing above 108.50 today implies 70 pips of recovery to 109.20 which is an old near term low and basis of overhead supply. The 21 day moving average (today at 109.25) has been an excellent gauge for the rebounds in recent weeks, whilst the channel resistance comes in at 109.45.
Gold
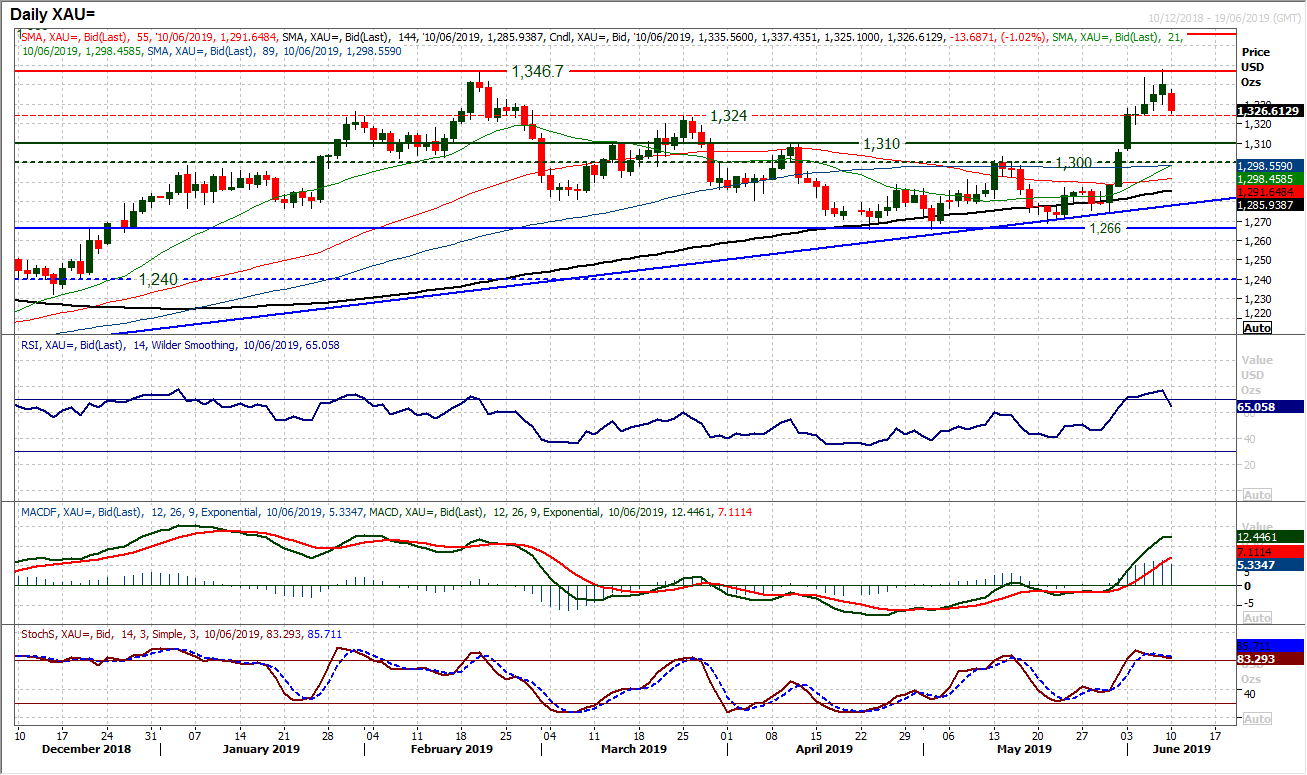
Gold ticked a dollar above the key 2019 high at $1347 on Friday, but could not hold the move into the close. With a shift in sentiment this morning, suddenly a bout of profit taking threatens. Since 2014, all rallies have repeatedly failed in the $1347/$1375 band. Hitting higher daily lows in each of the past six sessions, this run has come to an end today as a negative candle is in the making. Closing at or around these levels would mean the RSI back under 70 for the first time in a week, which is a negative signal, whilst Stochastics also threaten to roll over. The hourly chart shows momentum is turning coercive now, with the negative divergences on RSI and MACD finally taking their toll as the indicators turn into negative configuration. There is support in the band $1327/$1328 is now being tested, a breach of which would open $1324 as an old key breakout but also a low at $1320. Today’s high at $1337 is initial resistance.
WTI Oil
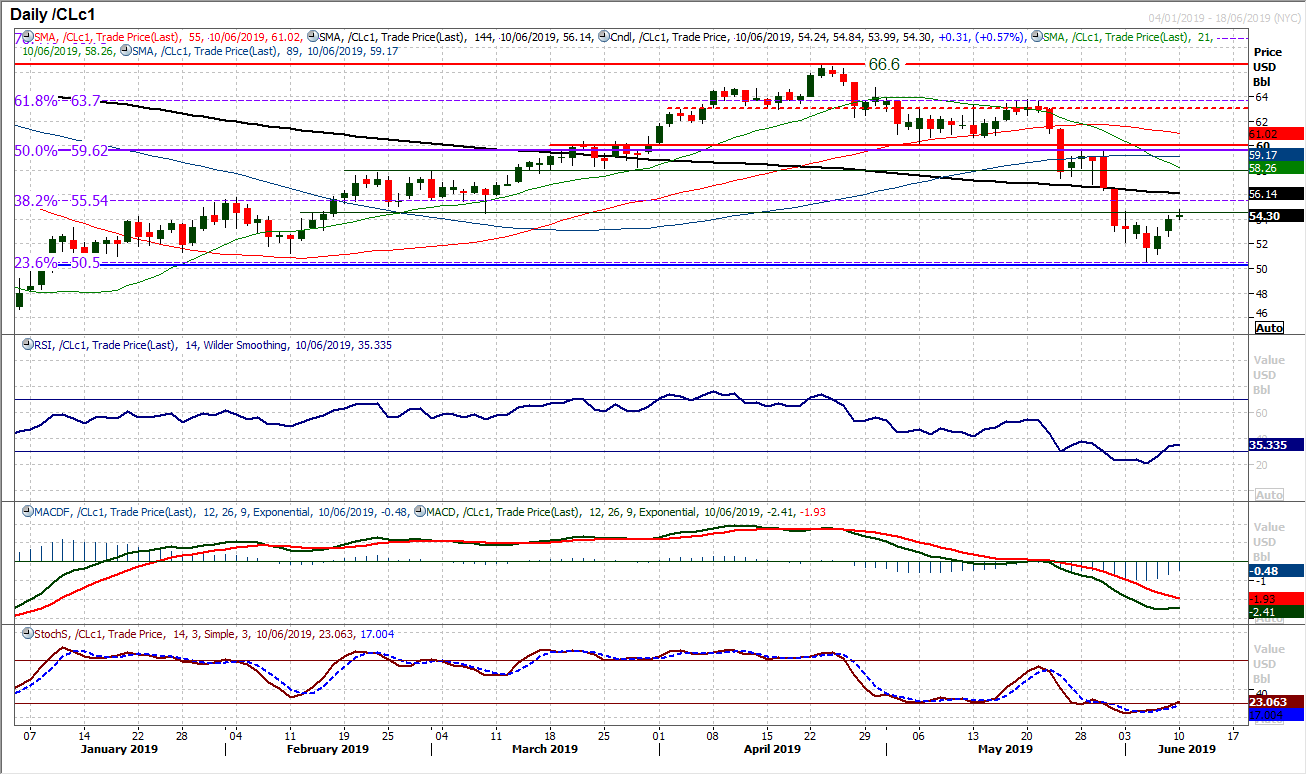
A second positive close on Friday was the first successive occasion in three weeks. It also suggests the market is forging key support around $50.00. We have talked previously about the importance of $50.00 (psychological), $50.50 (23.6% Fibonacci retracement) and $50.60 (last week’s low) as support. However, the bulls need to back up this rebound with a reversal and it looks to be coming on a near term basis. A move on the hourly chart above $53.80 is forming a mini base pattern and implies around $3.20 of recovery now. It comes with hourly momentum more positively configured too. Holding above $53.80 neckline which is now supportive will continue the recovery, whilst rising above $54.65 resistance would confirm the move. The 38.2% Fibonacci retracement at $55.50 is an initial barrier, with little real resistance until $57.30. Friday’s post-payrolls low at $52.60 is a higher low within the rebound.
Dow Jones Industrial Average
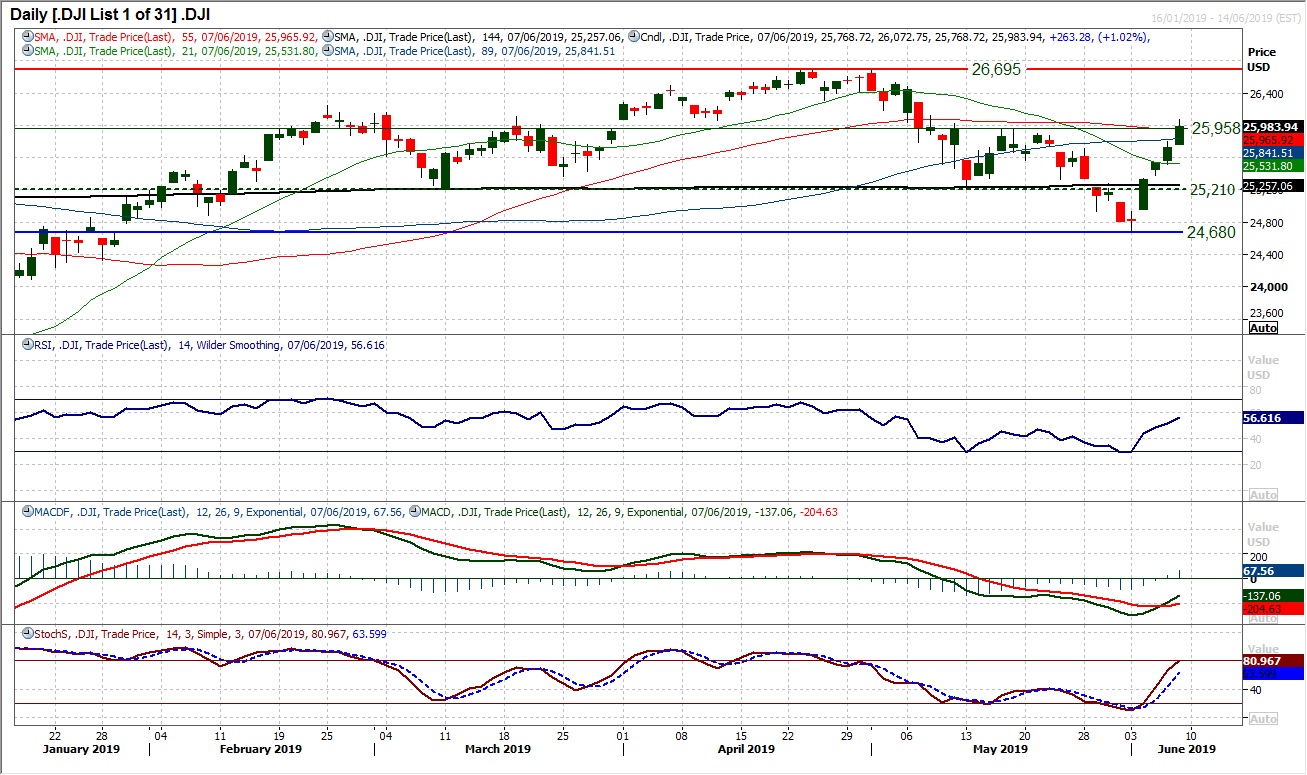
The Dow is on a run now. Consistent gains on a daily basis, the move has now completed four strong bull candles in a row. The move on Friday has also now broken above the key resistance at 25,597. This move above a key reaction high has effectively aborted the previous head and shoulders top formation. The argument is certainly there to suggest that the market will now move to retest the old high at 26,695. It comes with increasingly positive momentum. The RSI is strongly rising above 50 now, whilst MACD lines have bull crossed. The hourly chart is slightly stretched but there is good support now between 25,710/25,567. The initial resistance is 26,180.
Author

Richard Perry
Independent Analyst


