Tomorrow is options expiration, it probably won't matter

Tomorrow is options expiration, it probably won't matter
Statistically, the January options expiration in the stock indices has resulted in moderate declines. Yet, options expiring in 2023 isn't the same event it was in years prior. The financial exchanges have added options expirations every day of the week and even at various times of the trading session. In other words, options expiration is now a daily event.
Of course, more traders are using monthly options and with larger position sizes, but it simply isn't a game-changing scenario like it used to be. This is partly because aggressive speculators have spread their positions into various short-term instruments; many are trading options on the day of expiration. Lower monthly options expiration volatility is also a function of traders having more tools to hedge their price risk. For instance, those trading the monthly options can use weekly options to pinpoint their risk hedge. This takes a lot of emotion out of the equation that might otherwise cause significant price swings as market participants employ panicked decision-making.
We suspect the bottom of the trading wedge will act as a magnet to market prices with or without options expiration. This should pull the March S&P 500 future toward 3875.
Treasury futures markets
30-year Treasury Bond Futures
The treasury rally is facing overhead resistance
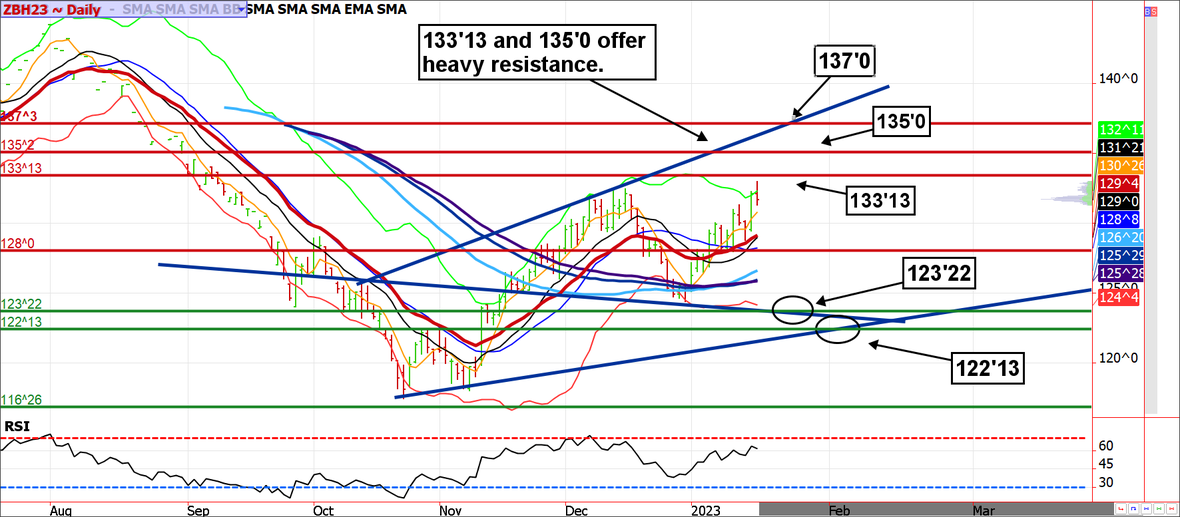
We aren't bearish bonds and notes, but we are also aware of technical resistance that could send prices into correction mode. In the 30-year bond, we see 133'13 and 135'0 as potential trigger points for a pullback. In the 10-year note, we might already be there—the 116'0 level marks trendline resistance.
It should be noted that the debt ceiling hoopla is just that. It will eventually work itself out, probably at the last minute. Yet, in the meantime, it could keep buyers of Treasuries willing to pay a premium for safety. If so, we expect this to be more of a February story.
Further, the US dollar has played a large part in the Treasury recovery. If the greenback finds a way to correct higher, as we suspect will be the case, it will be a headwind to bonds and notes; thus, encouraging a pullback from technical resistance levels.
Treasury futures market consensus:
Late January and most of February tend to see bond selling, likewise, the chart suggests a potential reversal somewhere between 133'0 and 135'0.
Technical Support: 128'0, 124'0, 121'0, and 117'0 ZN: 113'18, 111'26, 110'10, 108'31.
Technical Resistance: ZB: 133'13, and 135'02 ZN: 115'30 and 117'0.
Stock index futures
4040 was actually 4035
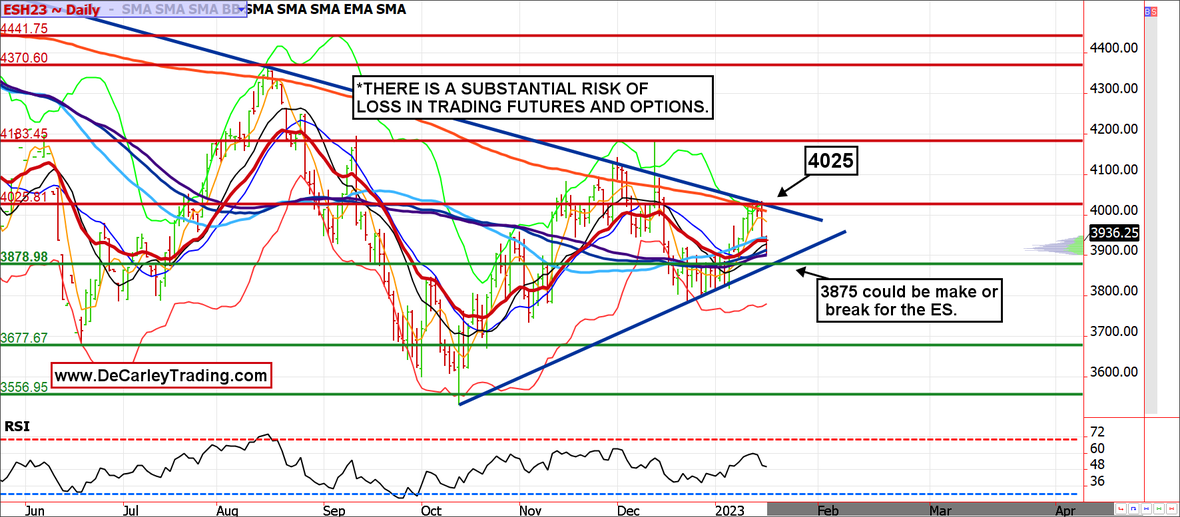
Things change fast in this business. Last week we were eying trendline resistance near 4040; we now know it has failed, and prices have been retreating toward the lower end of the trading wedge. We see uptrend support coming in near 3875. Just like how the market reacted to 4040 (actually 4035) changed the tone of trade, 3875 has the power to do so.
We can discuss fundamentals, options expiration, etc., until we are blue in the face, but the truth is these technical levels matter. If you are feeling bullish, 3875 is the place to give it a go. If you are bearish with open profits, don't hesitate to lock them in. However, a decisive break below 3875 could lead to cascading selling with the bears putting 3500/3450 in their crosshairs.
Stock index futures market consensus:
If the bulls give up 3875, we might finally get the sweeping retest of the October lows many have been looking for. If not, look out above...the short squeeze could be epic.
Technical Support: 3875, 3766, 3675, 3550, 3400, 3250, 3000.
Technical Resistance: 4025, 4185, 4370, and 4440.
E-mini S&P futures swing/day trading levels
These are counter-trend entry ideas. The more distant the level, the more reliable, but the less likely it is to get filled.
ES Day Trade Sell Levels: 4025, 4130, 4185.
ES Day Trade Buy Levels: 3875/3850, 3760, 3750, 3710, 3550, 3475.
In other commodity futures and options markets
September 8 - Buy March 2023 Yen 7800 calls near 50 ticks.
September 16 - Buy March Cocoa 2350 call.
September 20 - Buy March sugar 18.00 call.
October 7 - January soybean 14/14.80 call spread.
October 7 - February crude oil 85/75 put spread with a naked 100 call to finance the trade.
October 10 - Buy the March wheat 9.00/8.00 put spread and sell the 12.00 call.
October 11 - Buy January coffee 220/240 call spread and sell the 190 put.
October 26 - Buy the January wheat 8.75/9.25 call spread for about 15 cents.
October 28 - Buy May soybean meal 410 call.
November 4 - Buy February $85/$80 crude oil put spread and sell the $103 call for a credit of about $1,000.
November 11 - Buy January sugar 19.50 put for about 40 ticks.
November 16 - Buy May coffee 170/200 call spread and sell a naked 140 put to finance the trade.
November 21 - Buy March cocoa 2600 call near 70 points ($700).
December 2 - Buy May wheat $8.00 call, sell the $9.00 call and sell the $7.00 put for a net cost of about 5 cents ($250).
December 23 - Buy March sugar 20.75 put for about 70 points ($784).
December 23 - Sell April nat gas $3.50 put.
January 10 - Sell March e-mini S&P 500 strangles using the 4150 call and the 3550 put.
January 10 - Buy May corn $7.00 calls near 13 cents.
Author

Carley Garner
DeCarley Trading
Carley Garner is an experienced commodity broker with DeCarley Trading, a division of Zaner, in Las Vegas, Nevada. She is also the author of multiple books including, “Higher Probability Commodity Trading” and “A Trader's First Book on Commodities”.


