Today we have PPI numbers

USD: Mar '25 is Up at 103.725.
Energies: Apr '25 Crude is Down at 67.47.
Financials: The Jun '25 30 Year T-Bond is Lower by 11 ticks and trading at 116.06.
Indices: The Mar '25 S&P 500 emini ES contract is 41 ticks Lower and trading at 5494.50.
Gold: The Apr'25 Gold contract is trading Up at 2955.90.
Initial conclusion
This is not a correlated market. The USD is Up and Crude is Down which is normal, but the 30 Year T-Bond is trading Lower. The Financials should always correlate with the US dollar such that if the dollar is Higher, then the bonds should follow and vice-versa. The S&P is Lower and Crude is trading Lower which is not correlated. Gold is trading Higher which is not correlated with the US dollar trading Up. I tend to believe that Gold has an inverse relationship with the US Dollar as when the US Dollar is down, Gold tends to rise in value and vice-versa. Think of it as a seesaw, when one is up the other should be down. I point this out to you to make you aware that when we don't have a correlated market, it means something is wrong. As traders you need to be aware of this and proceed with your eyes wide open. All of Asia traded Lower except the Singapore exchange. Europe is trading mainly Higher with the exception of the Milan and German Dax.
Possible challenges to traders
-
Core PPI m/m is out at 8:30 AM EST. This is Major.
-
PPI m/m is out at 8:30 AM EST. This is Major.
-
Unemployment Claims are out at 8:30 AM EST. This is Major.
-
Natural Gas Storage is out at 10:30 AM EST. This is Major.
-
30 Year Bond Auction Starts at 1 PM EST. This is Major.
Traders, please note that we've changed the Bond instrument from the 10 year (ZN) to the 2 year (ZT). They work exactly the same.
We've elected to switch gears a bit and show correlation between the 2-year Treasury notes (ZT) and the S&P futures contract. The YM contract is the Dow Jones Industrial Average, and the purpose is to show reverse correlation between the two instruments. Remember it's likened to a seesaw, when up goes up the other should go down and vice versa.
Yesterday the ZT veered Higher at around 8:30 AM EST as the all-important CPI numbers were released. The Dow moved Lower at the same time. Look at the charts below and you'll see a pattern for both assets. The Dow moved Lower at 8:30 AM EST and the ZT moved Higher at around the same time. These charts represent the newest version of Bar Charts, and I've changed the timeframe to a 15-minute chart to display better. This represented a Long opportunity on the 2-year note, as a trader you could have netted about 20 plus ticks per contract on this trade. Each tick is worth $7.625. Please note: the front month for ZT is now Jun '25 and the Dow is still Mar '25. I've changed the format to filled Candlesticks (not hollow) such that it may be more apparent and visible.
Charts courtesy of barcharts
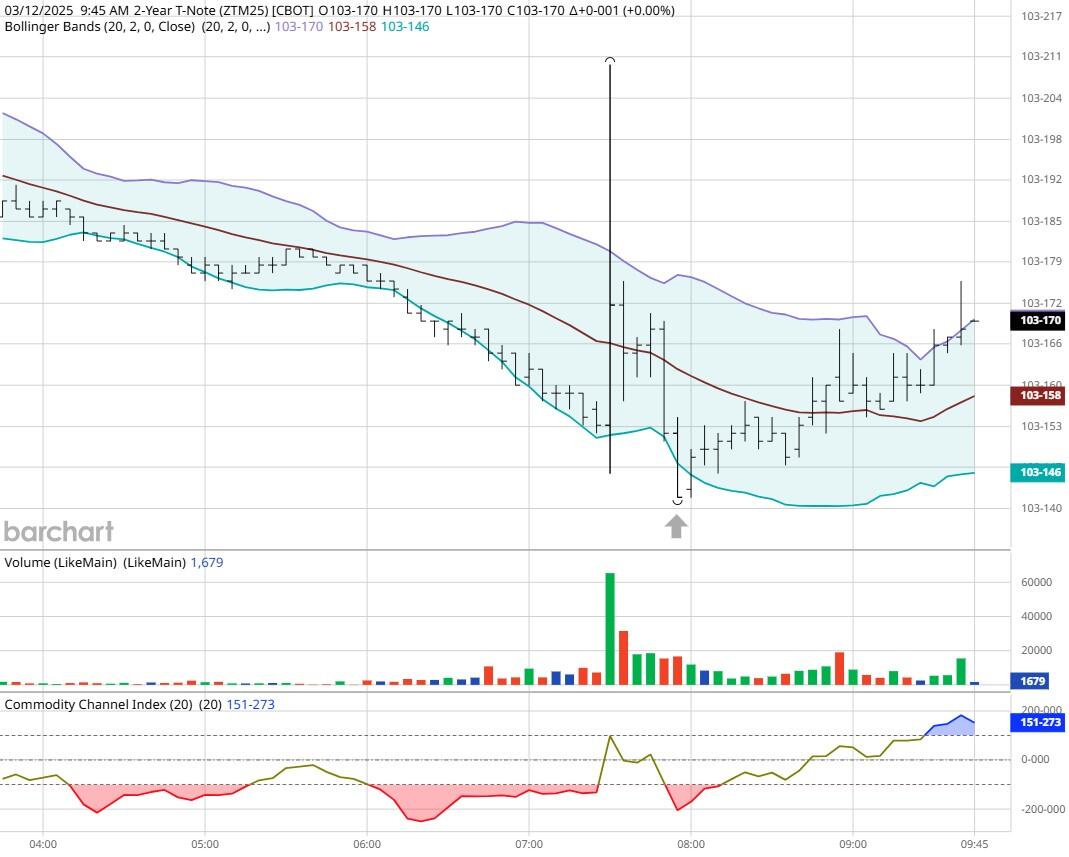
ZT -Jun 2025 - 3/12/25
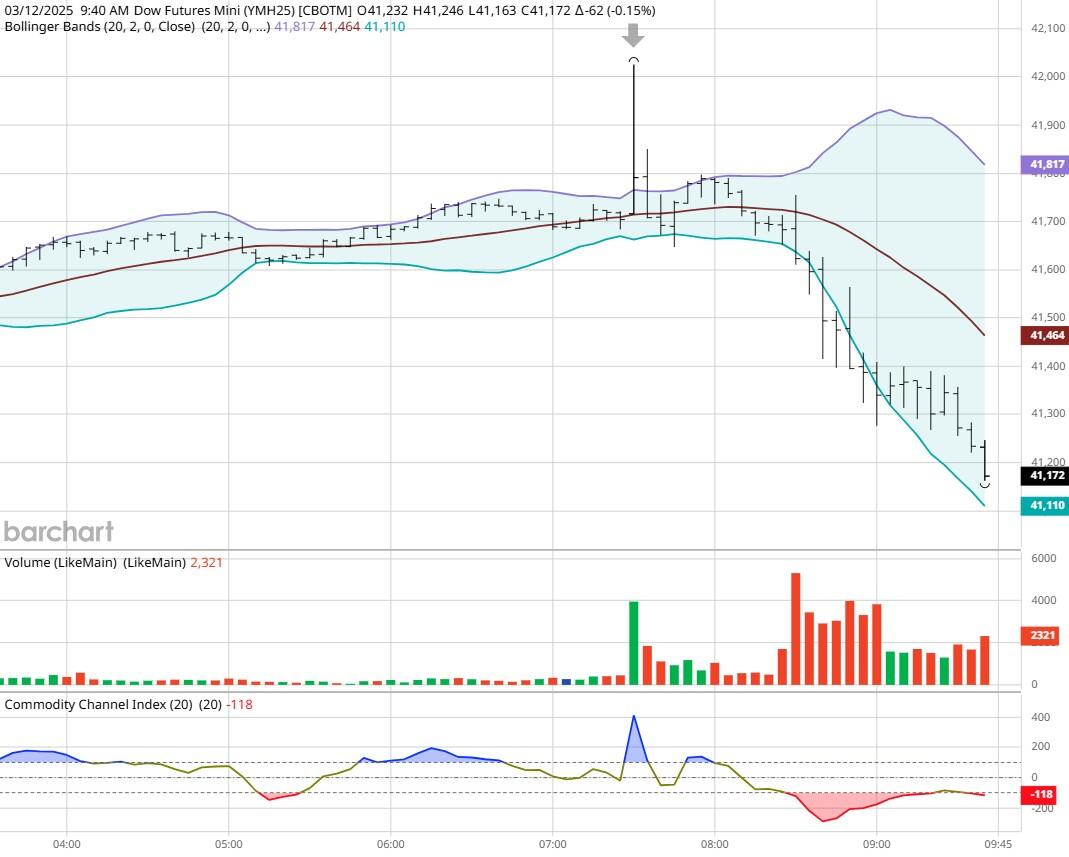
Dow - Mar 2025- 3/12/25
Bias
Yesterday we gave the markets a Neutral or Mixed bias and the markets traded mixed however the CPI came out at 8:30 AM EST where it was revealed that the consumer price numbers weren't as bad as many thought. The Dow closed Lower by 83 points, but the other indices closed Higher as well. Today we aren't dealing with a correlated market, and our bias is to the Downside
Could this change? Of Course. Remember anything can happen in a volatile market.
Commentary
Well, the all-important CPI numbers was released yesterday, and it came in at 2.8% percent Higher which was two tenths of one percent Higher. Not enough to get the Federal Reserve to reduce rates but not enough to set the house on fire either. Today we have PPI numbers which is very much like CPI for producers and suppliers of raw materials and components.
Author

Nick Mastrandrea
Market Tea Leaves


