![]() Nick Mastrandrea
Nick Mastrandrea
Market Tea Leaves
US Dollar: Jun '22 USD is Down at 104.825.
Energies: Jun '22 Crude is Up at 107.50.
Financials: The Jun '22 30 Year bond is Down 42 ticks and trading at 139.20.
Indices: The Jun '22 S&P 500 emini ES contract is 148 ticks Higher and trading at 3964.25.
Gold: The Jun'22 Gold contract is trading Down at 1822.00. Gold is 25 ticks Lower than its close.
Initial conclusion
This is not a correlated market. The dollar is Down, and Crude is Up which is normal, and the 30-year Bond is trading Lower. The Financials should always correlate with the US dollar such that if the dollar is lower, then the bonds should follow and vice-versa. The S&P is Higher, and Crude is trading Higher which is not correlated. Gold is trading Lower which is not correlated with the US dollar trading Up. I tend to believe that Gold has an inverse relationship with the US Dollar as when the US Dollar is down, Gold tends to rise in value and vice-versa. Think of it as a seesaw, when one is up the other should be down. I point this out to you to make you aware that when we don't have a correlated market, it means something is wrong. As traders you need to be aware of this and proceed with your eyes wide open. All of Asia is traded Higher with the exception of the Indian Sensex exchange which is Lower. Currently all of Europe is trading Higher.
Possible challenges to traders today
-
Import Prices m/m out at 8:30 AM EST. This is Major.
-
Prelim UoM Consumer Sentiment is out at 10 AM EST. Major.
-
Prelim UoM Inflation Expectations is out at 10 AM EST. Major.
-
FOMC Member Mester Speaks at 12 Noon EST. Major.
Treasuries
Traders, please note that we've changed the Bond instrument from the 30 year (ZB) to the 10 year (ZN). They work exactly the same.
We've elected to switch gears a bit and show correlation between the 10-year bond (ZN) and the S&P futures contract. The S&P contract is the Standard and Poor's, and the purpose is to show reverse correlation between the two instruments. Remember it's likened to a seesaw, when up goes up the other should go down and vice versa.
Yesterday the ZN made its move at around 11:15 AM EST. The ZN hit a Low at around that time and the S&P moved Lower shortly thereafter. If you look at the charts below ZN gave a signal at around 11:15 AM EST and the S&P moved Lower at around the same time. Look at the charts below and you'll see a pattern for both assets. ZN hit a Low at around 11:15 AM EST and the S&P was moving Lower shortly thereafter. These charts represent the newest version of MultiCharts and I've changed the timeframe to a 15-minute chart to display better. This represented a Long opportunity on the 10-year note, as a trader you could have netted about 20 ticks per contract on this trade. Each tick is worth $15.625. Please note: the front month for the ZN is now Jun '22. The S&P contract is also Jun' 22 as well. I've changed the format to Heikin-Ashi such that it may be more apparent and visible.
Charts courtesy of MultiCharts built on an AMP platform
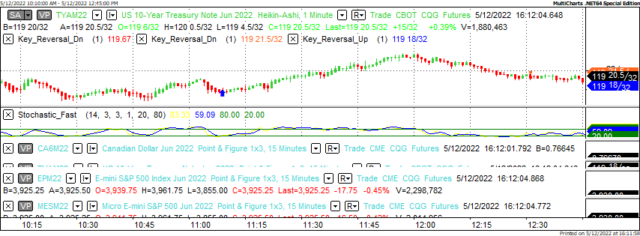
ZN - Jun 2022 - 05/12/22
-637880359769301556.png)
S&P - Jun 2022 - 05/12/22
Bias
Yesterday we gave the markets a Downside bias as both the USD and the Bonds were trading Higher Thursday morning, and this usually represents a Downside Day. The markets didn't disappoint much as the Dow dropped 104 points, the S&P dropped 5 and the Nasdaq gained 7. Today we aren't dealing with a correlated market and our bias is to the Upside.
Could this change? Of Course. Remember anything can happen in a volatile market.
Commentary
Yesterday the markets showed some semblance of Market Correlation as both the USD and the Bonds were trading Higher and that usually reflects a Down day. The indices did trade Lower with the exception of the Nasdaq which showed a gain of 7 points. Today we have preliminary numbers on economic optimism and inflation, both of which are major and proven market movers. Will this be enough to move all indices to the Upside finally? As in all things only time will tell.
Trading performance displayed herein is hypothetical. The following Commodity Futures Trading Commission (CFTC) disclaimer should be noted.
Hypothetical performance results have many inherent limitations, some of which are described below. No representation is being made that any account will or is likely to achieve profits or losses similar to those shown.
In fact, there are frequently sharp differences between hypothetical performance results and the actual results subsequently achieved by any particular trading program. One of the limitations of hypothetical performance trading results is that they are generally prepared with the benefit of hindsight.
In addition, hypothetical trading does not involve financial risk, and no hypothetical trading record can completely account for the impact of financial risk in actual trading. For example, the ability to withstand losses or to adhere to a particular trading program in spite of trading losses are material points which can also adversely affect actual trading results.
There are numerous other factors related to the markets in general or to the implementation of any specific trading program which cannot be fully accounted for in the preparation of hypothetical performance results and all of which can adversely affect actual trading results.
Trading in the commodities markets involves substantial risk and YOU CAN LOSE A LOT OF MONEY, and thus is not appropriate for everyone. You should carefully consider your financial condition before trading in these markets, and only risk capital should be used.
In addition, these markets are often liquid, making it difficult to execute orders at desired prices. Also, during periods of extreme volatility, trading in these markets may be halted due to so-called “circuit breakers” put in place by the CME to alleviate such volatility. In the event of a trading halt, it may be difficult or impossible to exit a losing position.
Recommended Content
Editors’ Picks

AUD/USD: The hunt for the 0.7000 hurdle
AUD/USD quickly left behind Wednesday’s strong pullback and rose markedly past the 0.6900 barrier on Thursday, boosted by news of fresh stimulus in China as well as renewed weakness in the US Dollar.

EUR/USD refocuses its attention to 1.1200 and above
Rising appetite for the risk-associated assets, the offered stance in the Greenback and Chinese stimulus all contributed to the resurgence of the upside momentum in EUR/USD, which managed to retest the 1.1190 zone on Thursday.

Gold holding at higher ground at around $2,670
Gold breaks to new high of $2,673 on Thursday. Falling interest rates globally, intensifying geopolitical conflicts and heightened Fed easing bets are the main factors.

Bitcoin displays bullish signals amid supportive macroeconomic developments and growing institutional demand
Bitcoin (BTC) trades slightly up, around $64,000 on Thursday, following a rejection from the upper consolidation level of $64,700 the previous day. BTC’s price has been consolidating between $62,000 and $64,700 for the past week.

RBA widely expected to keep key interest rate unchanged amid persisting price pressures
The Reserve Bank of Australia is likely to continue bucking the trend adopted by major central banks of the dovish policy pivot, opting to maintain the policy for the seventh consecutive meeting on Tuesday.

Five best Forex brokers in 2024
VERIFIED Choosing the best Forex broker in 2024 requires careful consideration of certain essential factors. With the wide array of options available, it is crucial to find a broker that aligns with your trading style, experience level, and financial goals.