Tipping points that Gold investors shouldn’t miss

The situation in gold and gold stocks is not stagnant. Something shifted. And the implications are not minor.
A moment of realization
In 1993, Aerosmith released the song called “Amazing”. I really enjoyed it when it came out and some of the lyrics stuck in my mind. When I was reviewing the charts to prepare today’s analysis, I recalled a part of that song. I wasn’t sure why, as it’s been sometime when I was listening to it.
But then it hit me. And as we move to the chart analysis, in particular the ones featuring the USD Index and the S&P 500 futures, you’ll see why. Here’s what I recalled:
It's amazing.
With the blink of an eye, you finally see the light.
Oh, it's amazing.
When the moment arrives that you know you'll be alright
In the song, it’s about a tipping point in life. And it seems that we reached tipping points in those two above-mentioned markets, which has implications for… Pretty much everything.
Let’s start with the key thing that happened and what didn’t happen at the same time.
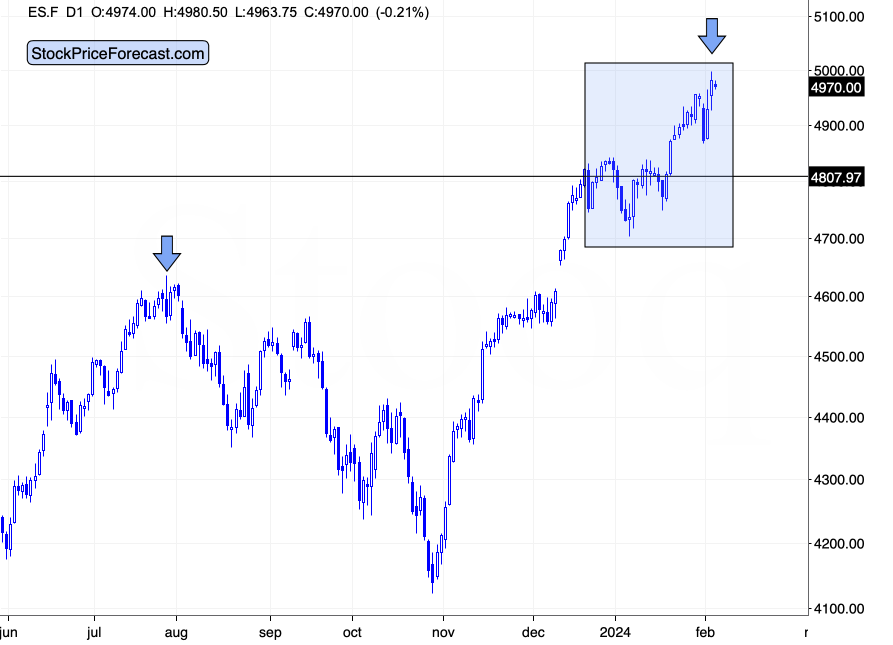
The S&P 500 Index futures approached the 5,000 level. Friday’s intraday high was 4997.75, after reaching which the futures retraced. They are slightly lower today.
I wrote on many occasions that round numbers are important from a psychological point of view, and there’s little doubt that 5,000 carries a significant weight in that regard. This level is super-important as resistance, but also as something that people can gravitate to.
“The S&P will rally to 5,000!” likely became a self-fulfilling prophecy, as people were buying all the way up to 5,000, actually causing the move that they had been foreseeing.
No fundamental trigger is necessary for that. In fact, this kind of emotional rally can happen against fundamental signs, like less dovish than expected signals from the Fed.
As the S&P 500 futures attempted to move to/above 5,000 and they moved back down, whatever was likely to happen based on the emotional upswing has probably already happened. It’s quite likely that the S&P futures’ move to 5,000 was the tipping point.
The S&P 500 Index futures were a bit higher than the index itself, which topped at 4,975.29, but that’s also very close to 5,000. This have been enough to trigger the final reversal, or it might be the case that we’ll see index’s move to 5,000 before it reverses. This would imply a move slightly above 5,000 in index futures, which could then invalidate this breakdown and both: index and futures based on it would fall – taking many other sectors with it. In particular, junior mining stocks.
If that wasn’t enough, we also saw a tipping point in the USD Index.
In my Jan. 30 analysis, I wrote the following:
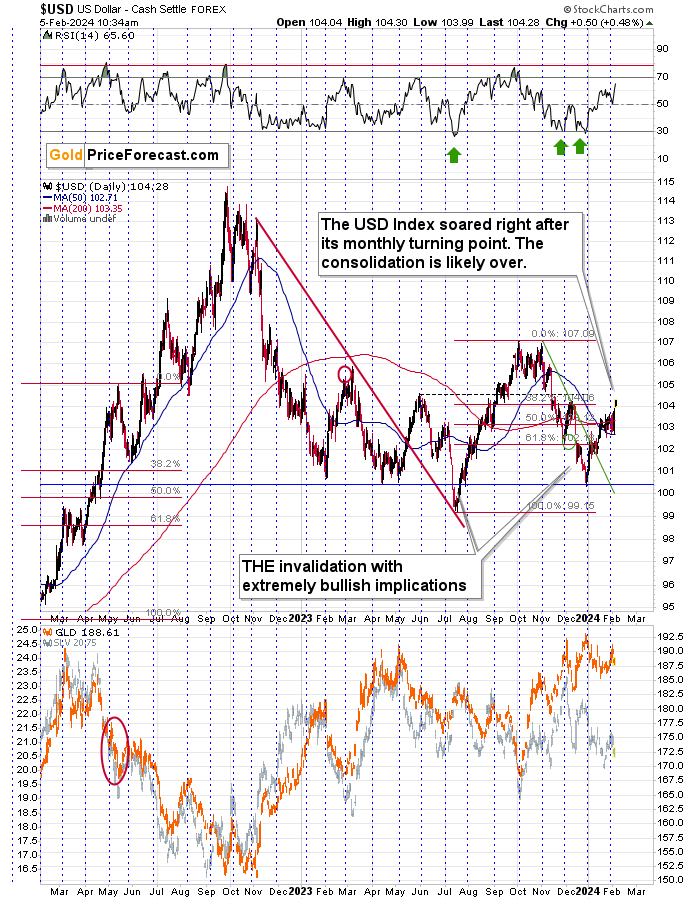
The USD Index tends to reverse its course right at or close to the turn of the month. I marked the previous times when the USDX reversed close to the turn of the month with dashed, blue lines. As you can see, this simple tendency has proven to be very effective.
Tomorrow is the last day of January, so we could see the reversal today or tomorrow. Or perhaps later this week. Either way, it’s most likely coming.
If it wasn’t for the very short-term move lower that we’re seeing now, the nature of this reversal could have been bearish. After all, the USDX is after a monthly rally.
Thanks to a dip in the USDX value, this cyclical tendency could result in another powerful upleg.
Of course, this would be particularly bearish for the precious metals sector, and it would very likely make our short positions more profitable.
That’s exactly what the USD Index did, and that was another tipping point. Friday’s decisive rally took the index well above the previous intraday highs, showing that the turning point had bullish implications. And as the U.S. currency is after over two weeks of consolidation, it’s definitely ready for another big upswing. This has bearish implications for commodities (yes, Anna’s profits in crude oil increase as a result), as well as for precious metals and mining stocks.
I’m not saying that the de-dollarization will never happen, but it’s unlikely to happen anytime soon.
Indeed, the USD Index is rallying today, and gold price is declining.
Gold's misinterpreted signals
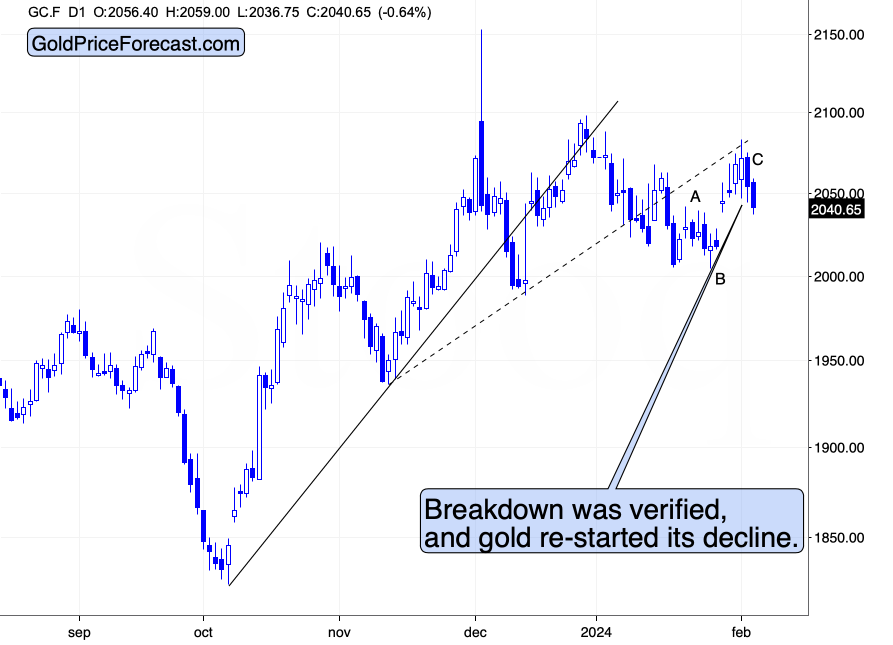
Many voices out there claimed that gold re-started its rally, but just taking a brief look at the position of gold’s resistance lines proves that it actually verified its breakdown.
Gold didn’t re-start its rally – it re-started its decline.
It might be difficult to notice it when looking at gold’s very recent price swings only, but gold topped in December, and it’s been forming lower highs since that time.
The most interesting part of the precious metals sectors’ performance is not visible on gold’s chart alone. We need to combine it with what gold stocks have been doing.
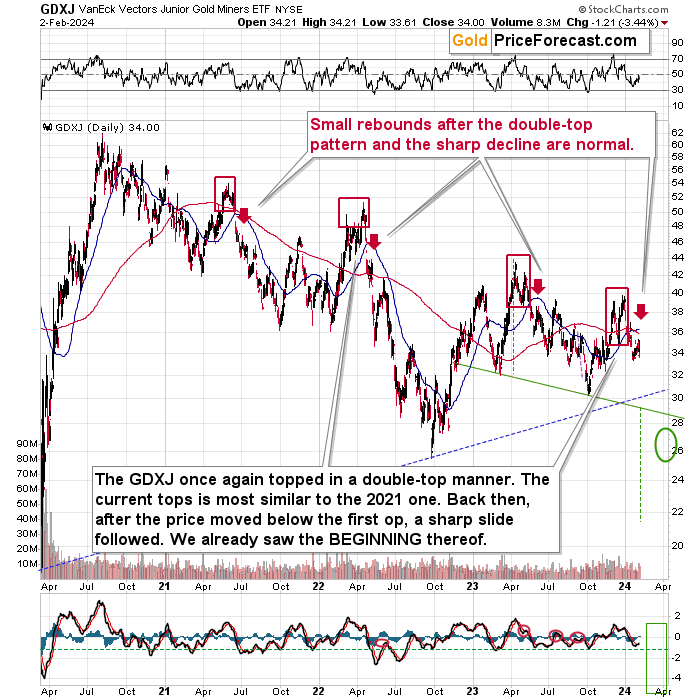
While gold closed last week relatively close to its recent high, the GDXJ closed close to its recent lows. And that happened even despite stock markets’ move to its all-time high!
It’s quite obvious that junior miners really can’t wait to decline here. And it’s likely that they won’t have to.
Want free follow-ups to the above article and details not available to 99%+ investors? Sign up to our free newsletter today!
Want free follow-ups to the above article and details not available to 99%+ investors? Sign up to our free newsletter today!
Author

Przemyslaw Radomski, CFA
Sunshine Profits
Przemyslaw Radomski, CFA (PR) is a precious metals investor and analyst who takes advantage of the emotionality on the markets, and invites you to do the same. His company, Sunshine Profits, publishes analytical software that any


