This market treats any miss as a negative and punishes swiftly

USD: Dec '24 is Down at 105.815.
Energies: Jan '25 Crude is Up at 68.16.
Financials: The Mar '25 30 Year T-Bond is Down 10 ticks and trading at 119.27.
Indices: The Dec '24 S&P 500 emini ES contract is 32 ticks Lower and trading at 6091.50.
Gold: The Feb'25 Gold contract is trading Up at 2679.20.
Initial conclusion
This is not a correlated market. The USD is Down and Crude is Up which is normal, and the 30 Year T-Bond is trading Lower. The Financials should always correlate with the US dollar such that if the dollar is Higher, then the bonds should follow and vice-versa. The S&P is Lower and Crude is trading Higher which is correlated. Gold is trading Higher which is correlated with the US dollar trading Down. I tend to believe that Gold has an inverse relationship with the US Dollar as when the US Dollar is down, Gold tends to rise in value and vice-versa. Think of it as a seesaw, when one is up the other should be down. I point this out to you to make you aware that when we don't have a correlated market, it means something is wrong. As traders you need to be aware of this and proceed with your eyes wide open. Asia traded Mixed. Europe is trading Mixed as well.
Possible challenges to traders
-
Lack of major economic news.
-
No economic news to speak of.
Traders, please note that we've changed the Bond instrument from the 10 year (ZN) to the 2 year (ZT). They work exactly the same.
We've elected to switch gears a bit and show correlation between the 2-year Treasury notes (ZT) and the S&P futures contract. The YM contract is the Dow Jones Industrial Average, and the purpose is to show reverse correlation between the two instruments. Remember it's likened to a seesaw, when up goes up the other should go down and vice versa.
On Friday the ZT migrated Higher at around 8:30 AM EST as the job numbers were released. The Dow migrated Lower at the same time. Look at the charts below and you'll see a pattern for both assets. The Dow moved Lower at 8:30 AM and the ZT moved Higher at around the same time. These charts represent the newest version of Bar Charts, and I've changed the timeframe to a 15-minute chart to display better. This represented a Long opportunity on the 2-year note, as a trader you could have netted about 30 plus ticks per contract on this trade. Each tick is worth $7.625. Please note: the front month for ZT is now Mar '25 and the Dow is still Dec '24. I've changed the format to filled Candlesticks (not hollow) such that it may be more apparent and visible.
Charts courtesy of barcharts
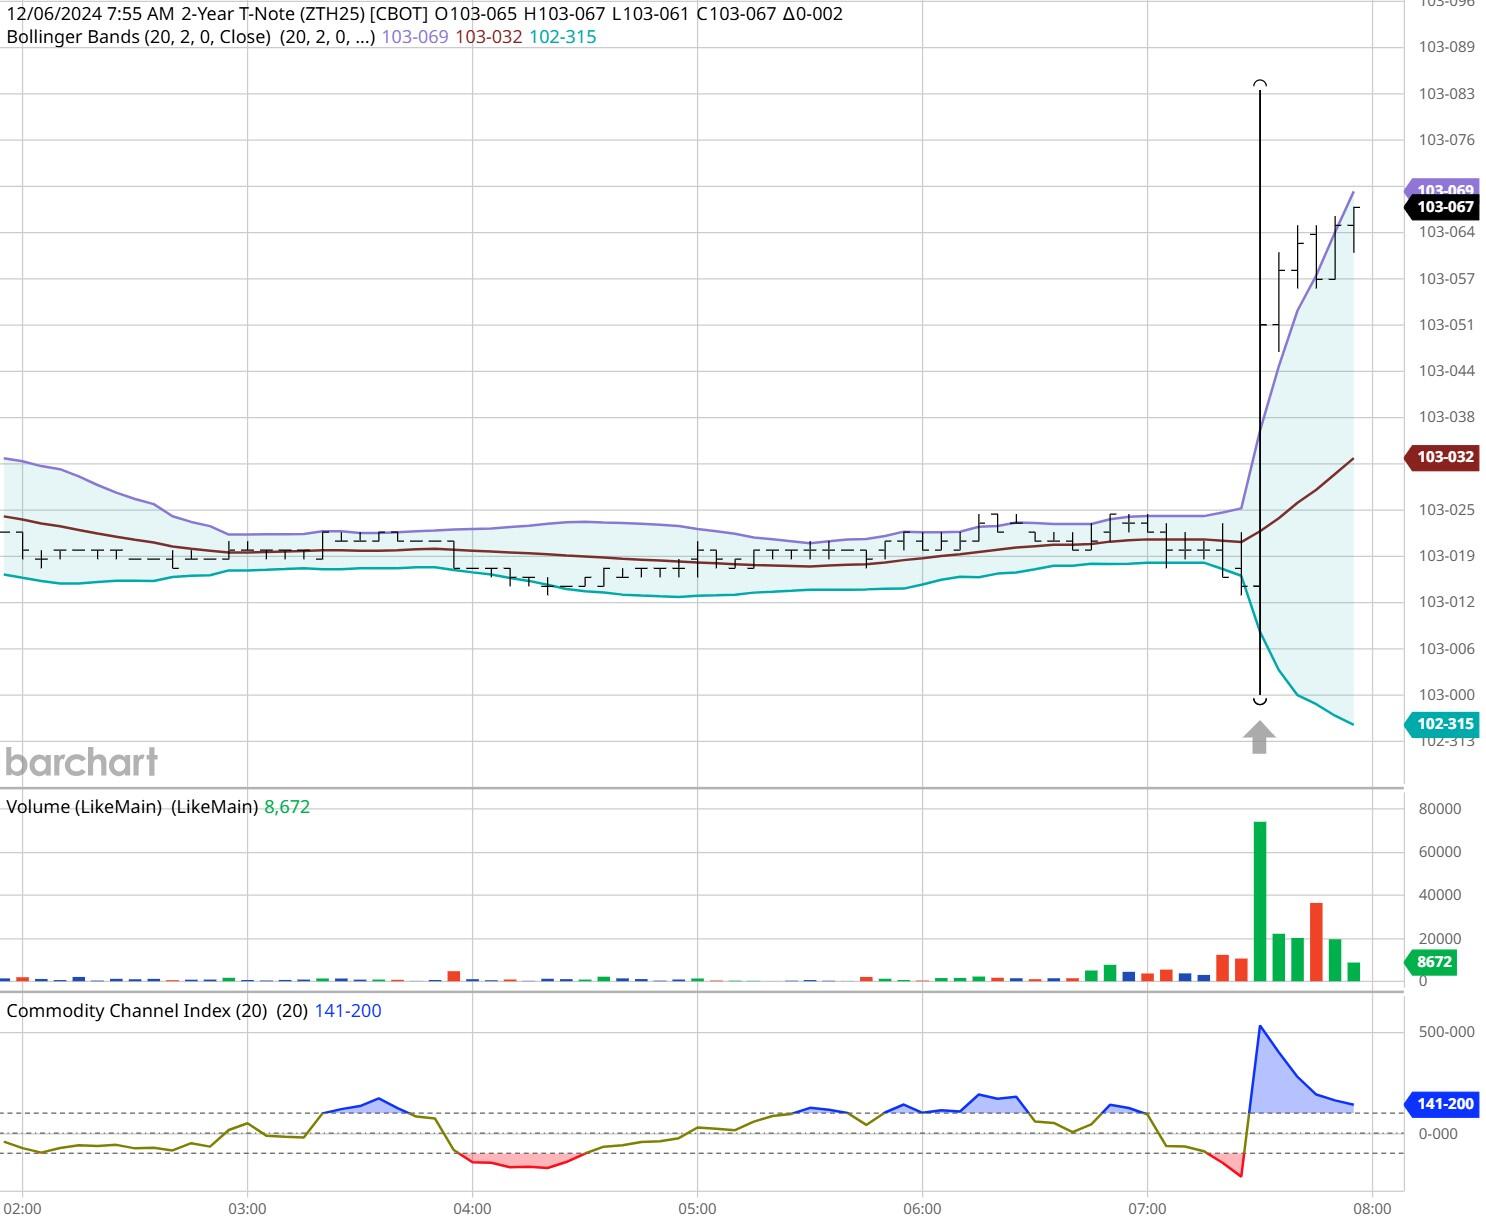
ZT -Mar 2025 - 12/06/24
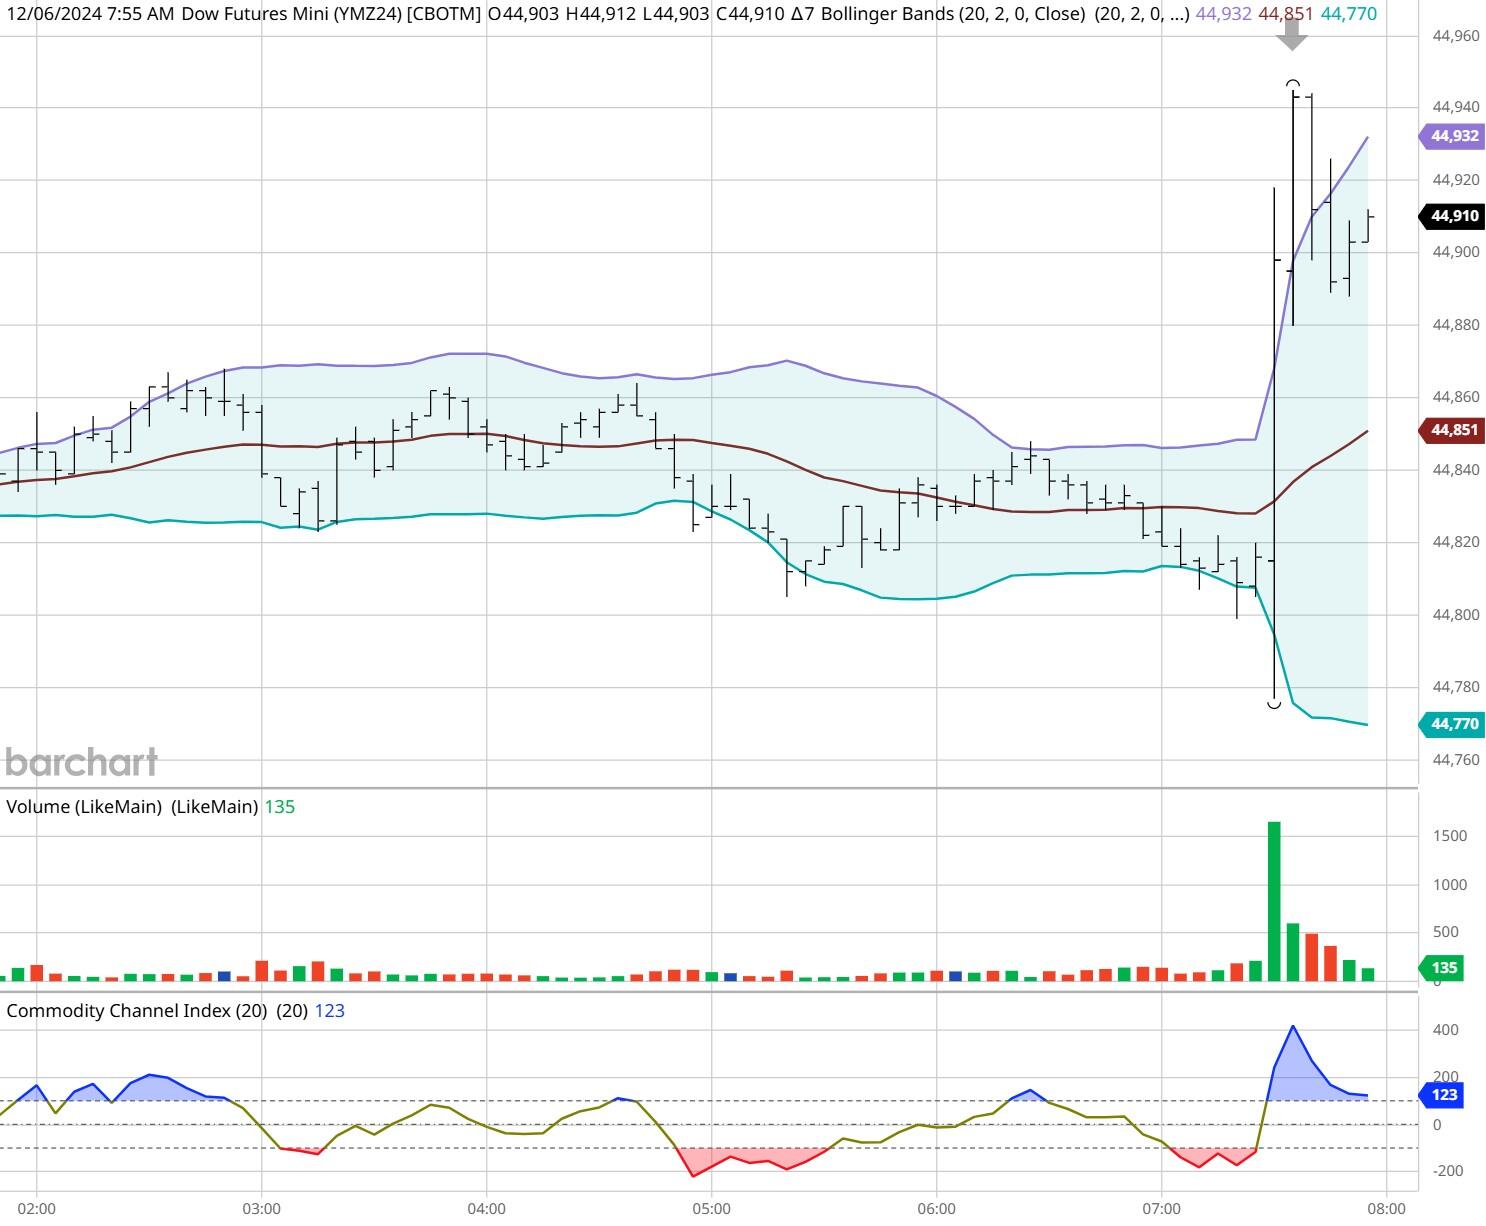
Dow - Dec 2024- 12/06/24
Bias
On Friday we gave the markets a Mixed bias as it was Jobs Friday, and we always maintain a Neutral bias on that day. The markets didn't disappoint as the Dow dropped 123 points but the S&P and Nasdaq both gained ground for the day. All in all, a Neutral or Mixed day for the markets. Today we aren't dealing with a correlated market and our bias will remain Mixed.
Could this change? Of Course. Remember anything can happen in a volatile market.
Commentary
On Friday as suggested the markets traded Mixed as the job numbers were released. The US economy created 227,000 net new jobs which beat estimates; however, the unemployment rose to 4.2% versus 4.1% prior. This is not unusual for this time of year as companies are refocusing their employment plans for 2025 and this number is fluid and subject to change. This market however treats any miss as a negative and punishes swiftly. Today we have no economic news to speak of so the markets will be left to their own devices.
Author

Nick Mastrandrea
Market Tea Leaves


