There are some bullish indicators in the Silver market

Silver has quietly had a strong start to 2025, with the price up 12.6 percent. However, it remains significantly underpriced compared to gold from a historical perspective with the gold-silver ratio still above 90-1.
The gold-silver ratio tells you how many ounces of silver it takes to buy one ounce of gold given the current spot price of both metals.
While industrial demand has a much bigger impact on the price of silver than gold, silver is still fundamentally a monetary metal and its price tends to track with gold over time. The gold-silver ratio reflects this relationship.
In the modern era, the gold-silver ratio has averaged between 40-1 and 60-1. The current ratio running so much wider than that historical spread indicates that silver is underpriced and is a bargain compared to gold.
As with most averages, the gold-silver ratio tends to eventually return to the mean when it gets significantly out of whack. Over the last few decades, this snap-back has tended to happen very quickly.
For instance, in 2020, the gold-silver ratio set a record of 123-1 as the pandemic gripped and then plunged to around 60-1 as central banks around the world cranked up the money creation machine to cope with governments shutting down economies.
The 2008 financial crisis and the Great Recession provide another example. The spread rose to over 80-1 in the early days of the crisis and then fell to 30-1 as the Federal Reserve cranked up the money printing machine.
These two examples indicate that there appears to be some correlation between the gold-silver ratio and central bank money creation. The spread tends to drop when the Fed cranks up money creation and opens back up when the central bank attempts to tighten monetary policy.
The ratio did narrow as the Fed began discussing monetary easing last summer, but it now appears that the central bank is trying to slow rate cuts due to sticky price inflation. Even so, the slowdown in balance sheet reduction the Fed initiated last summer and the three rate cuts late last year have already created a more inflationary environment with the money supply rising. This is, by definition, inflation. This has supported both gold and silver prices, along with market volatility caused by the flow of metal from London to New York due to tariff threats and other factors.
Given the level of debt and malinvestments in the economy due to decades of easy money, it's only a matter of time before the Fed is forced to lean back into monetary easing. This could be the catalyst to drive silver higher and close the gold-silver ratio.
The supply and demand dynamics also indicate that silver is underpriced.
There is also a technical indicator that is bullish for silver.
Last fall, I reported on a "secular cup and handle" pattern in silver. Since November, we have seen a short-term cup and handle patent develop within the handle of the larger secular trend.
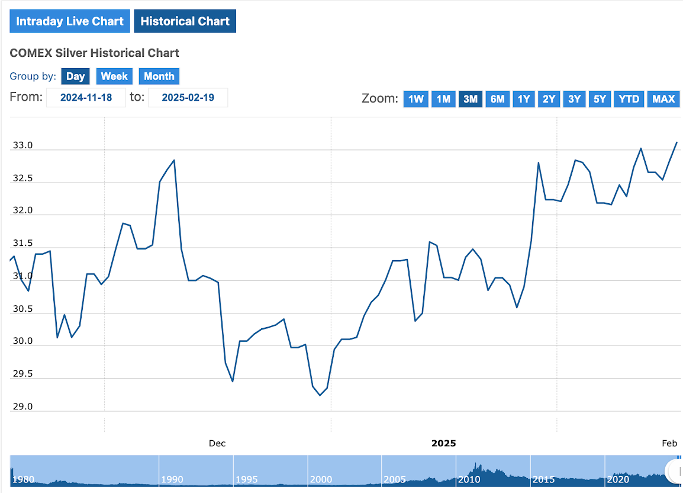
You can see the “cup” with the twin highs of just below $33 per ounce. Following the last peak, we see a dip in the price followed by what appears to be a consolidation “handle.”
A handle pattern on the chart of a stock or commodity often precedes a breakout.
This potential breakout will be something to watch for in the coming weeks.
Regardless, given the gold-silver ratio spread, silver appears to be set up for a significant leg up in the near to midterm. If this plays out as it has historically, this is a good time for investors to take advantage of silver's relatively lower price before the breakout begins.
To receive free commentary and analysis on the gold and silver markets, click here to be added to the Money Metals news service.
Author

Mike Maharrey
Money Metals Exchange
Mike Maharrey is a journalist and market analyst for MoneyMetals.com with over a decade of experience in precious metals. He holds a BS in accounting from the University of Kentucky and a BA in journalism from the University of South Florida.


